Images for presentations
This page provides some images that were created by myself and might be useful for presentations. You are welcome to use these images for your presentations etc., as long as proper credit is given. The images shown in this page are low-resolution, thumbnail images. Please click the images to get high resolution images.| Images | Paper/Credit | Some description |
|---|---|---|
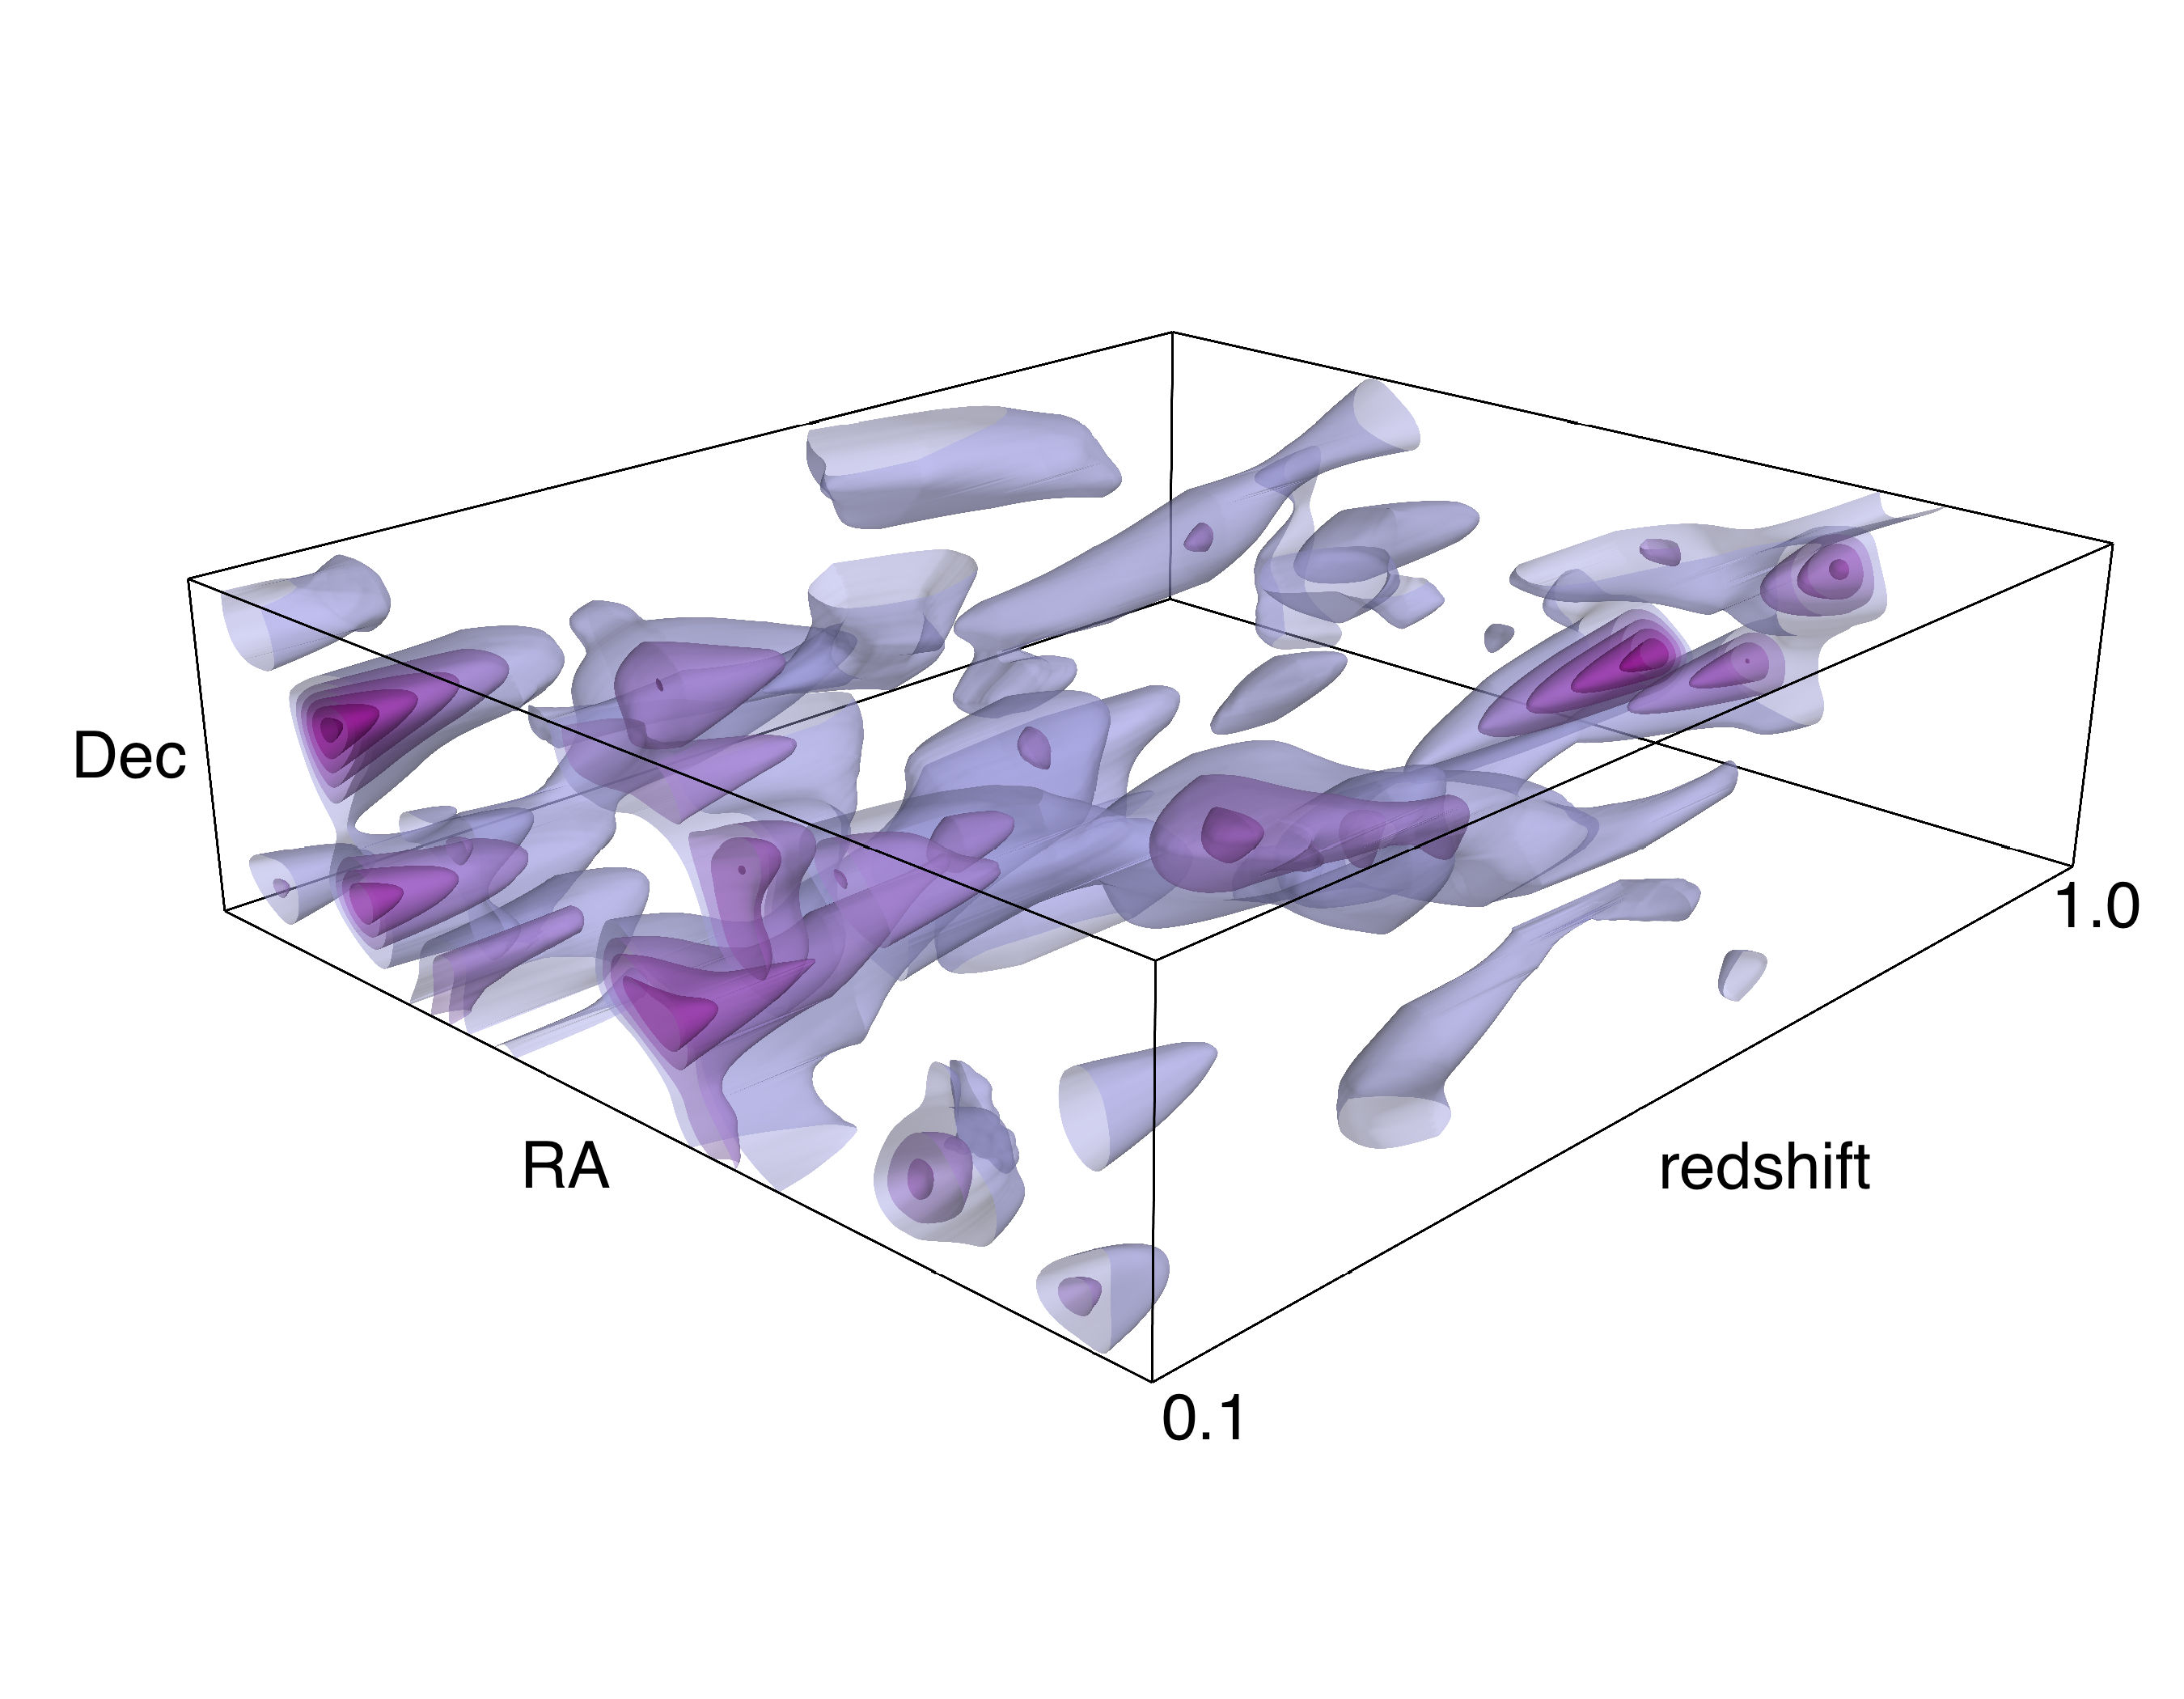 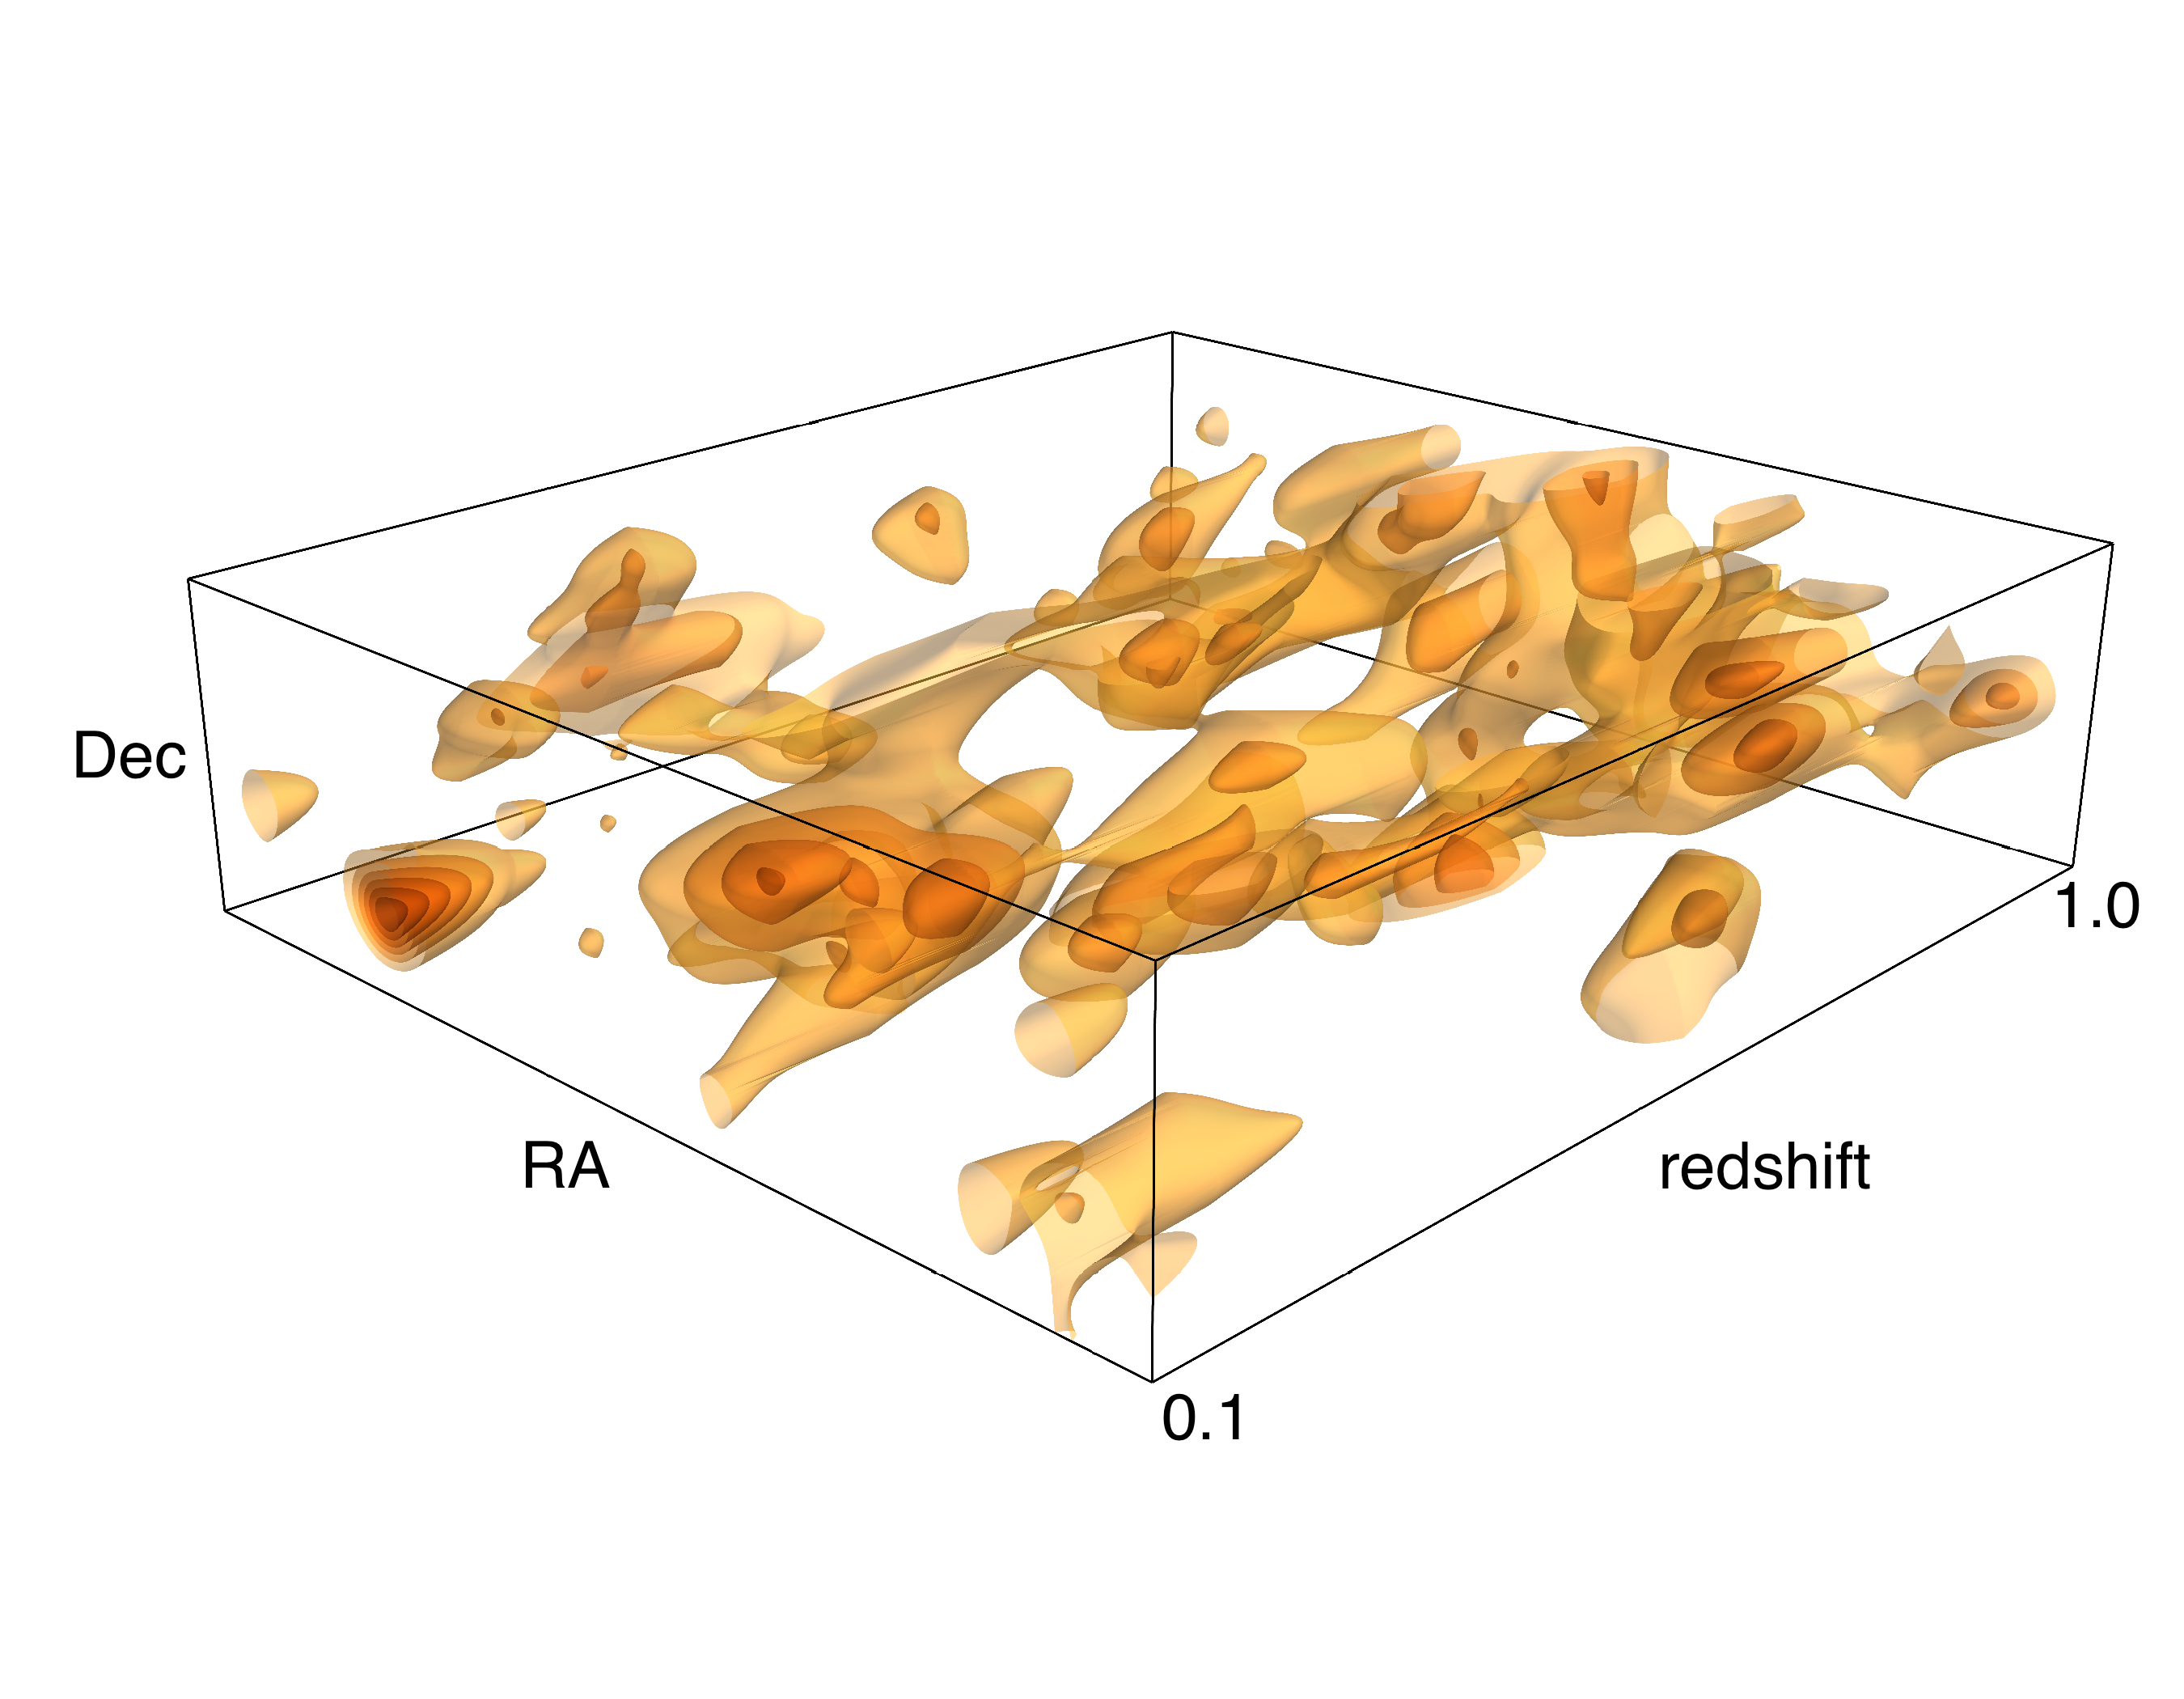 |
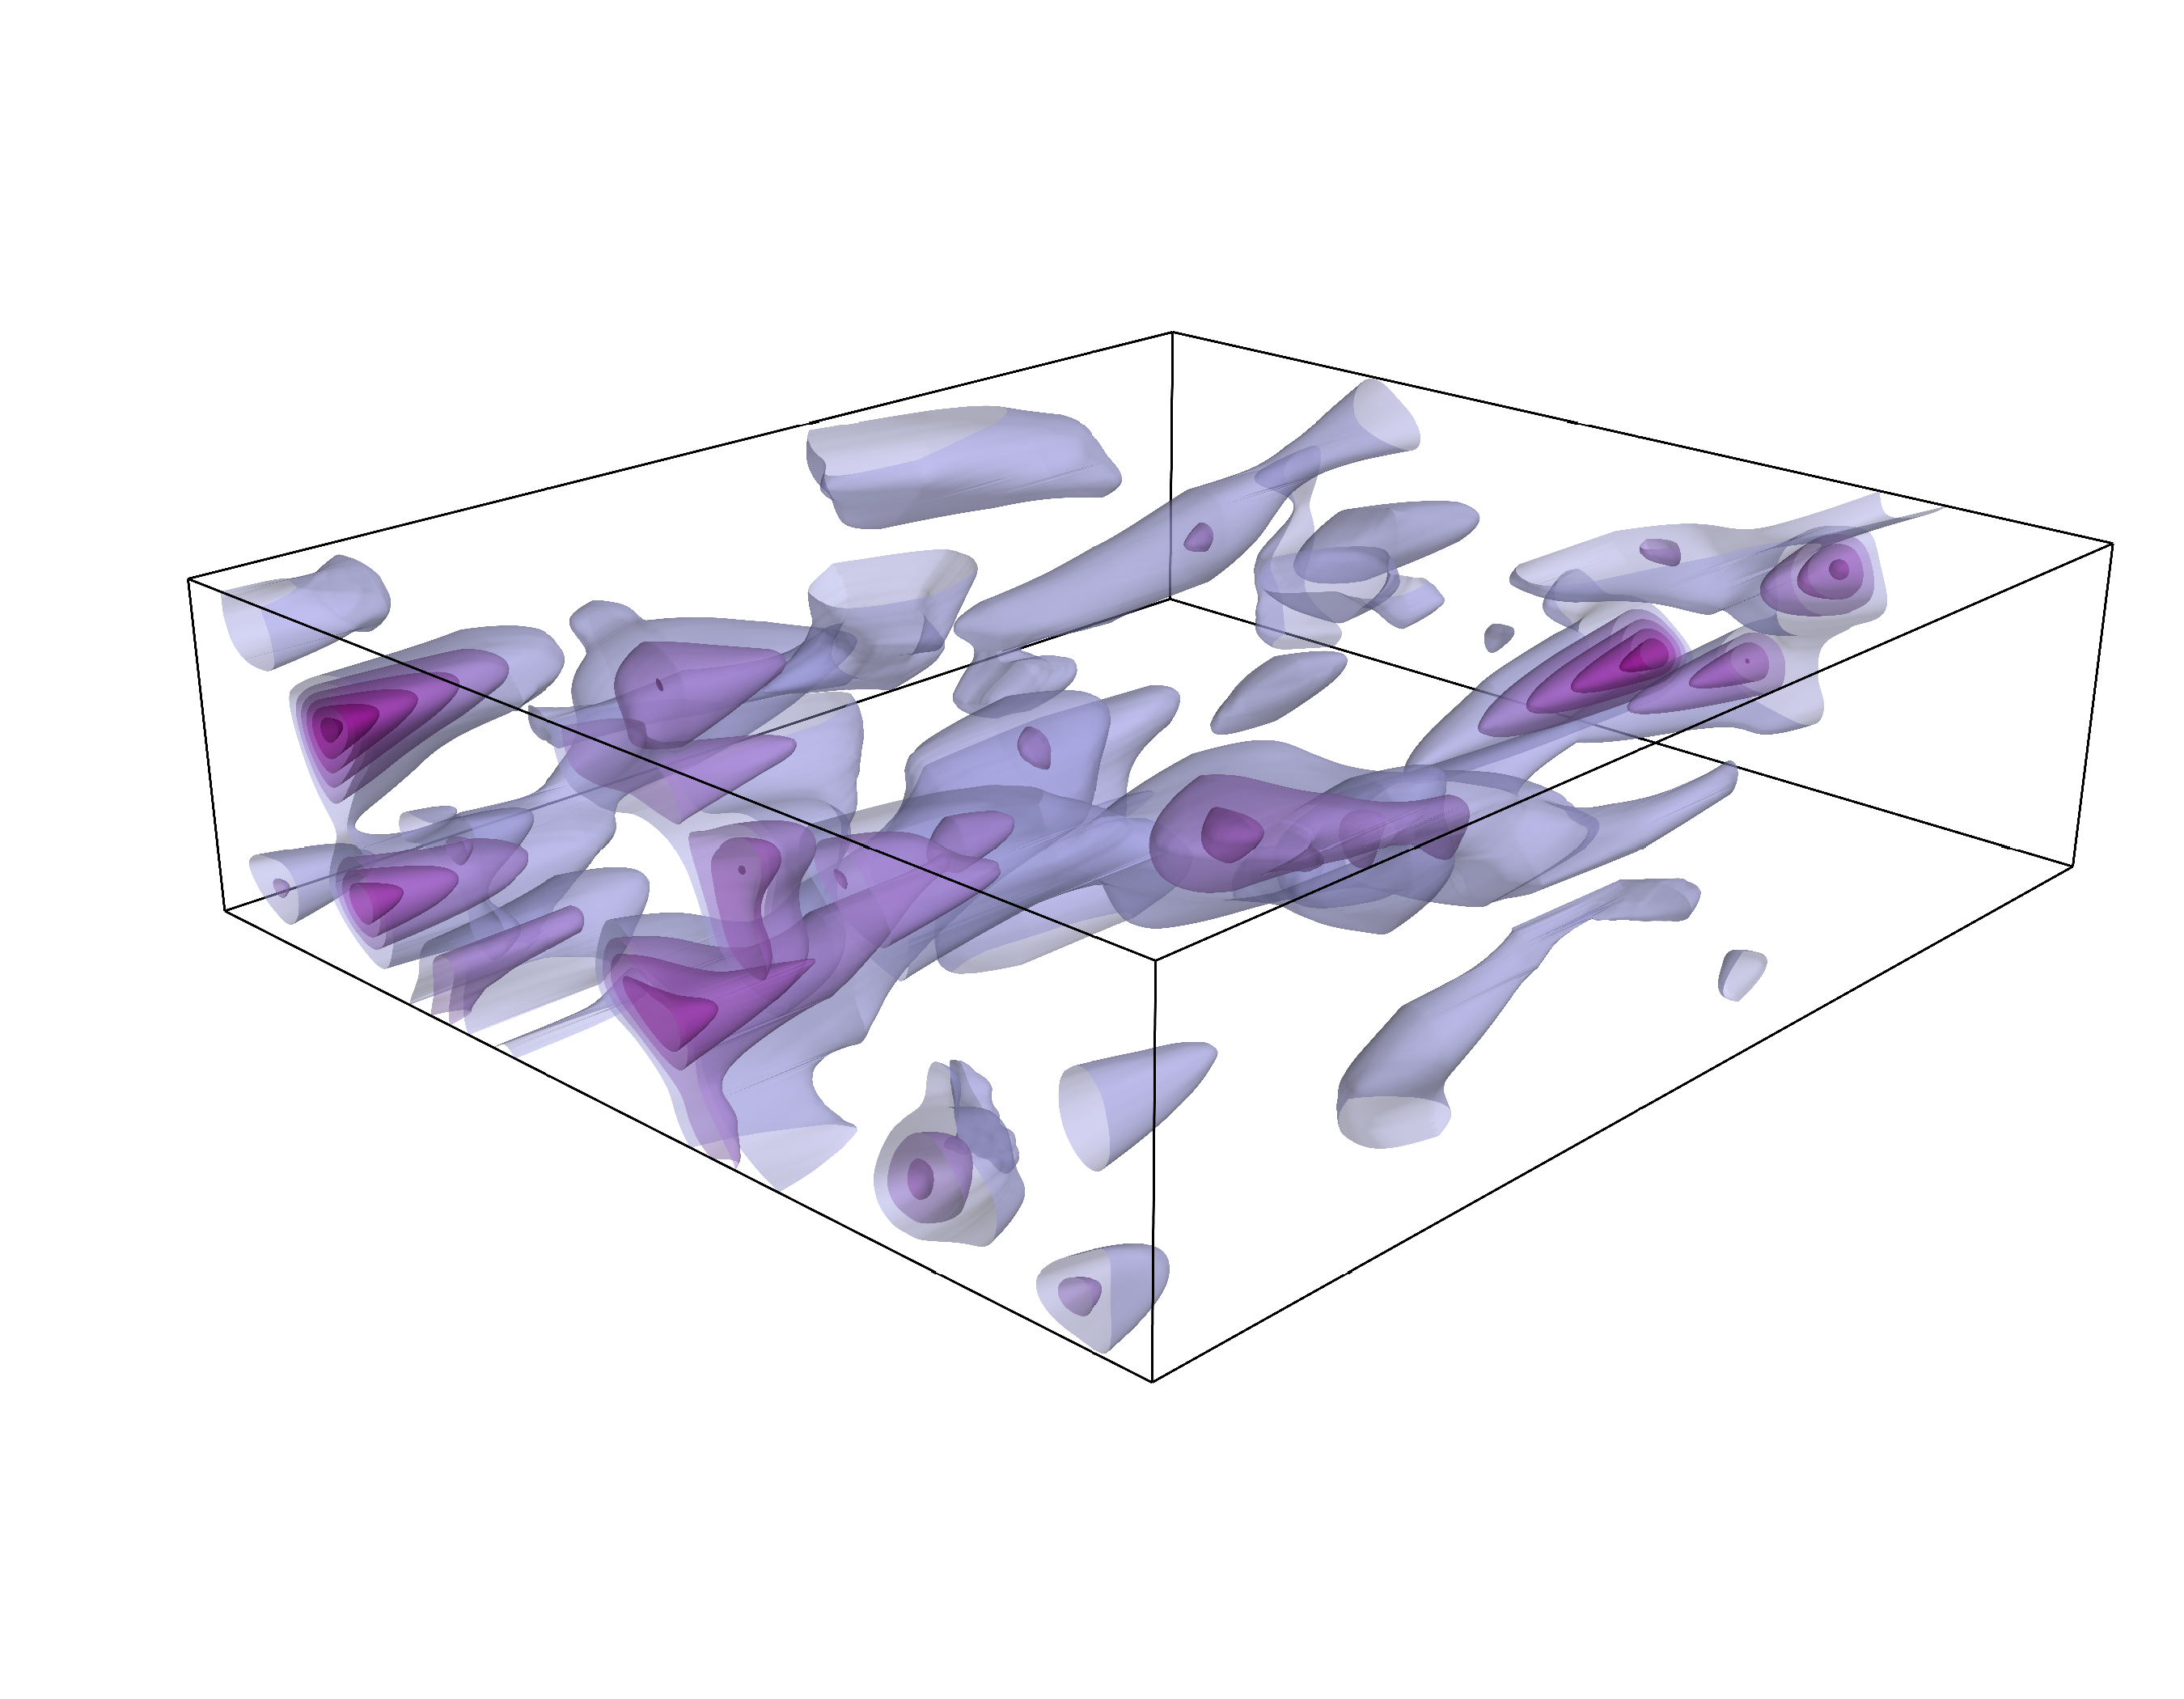
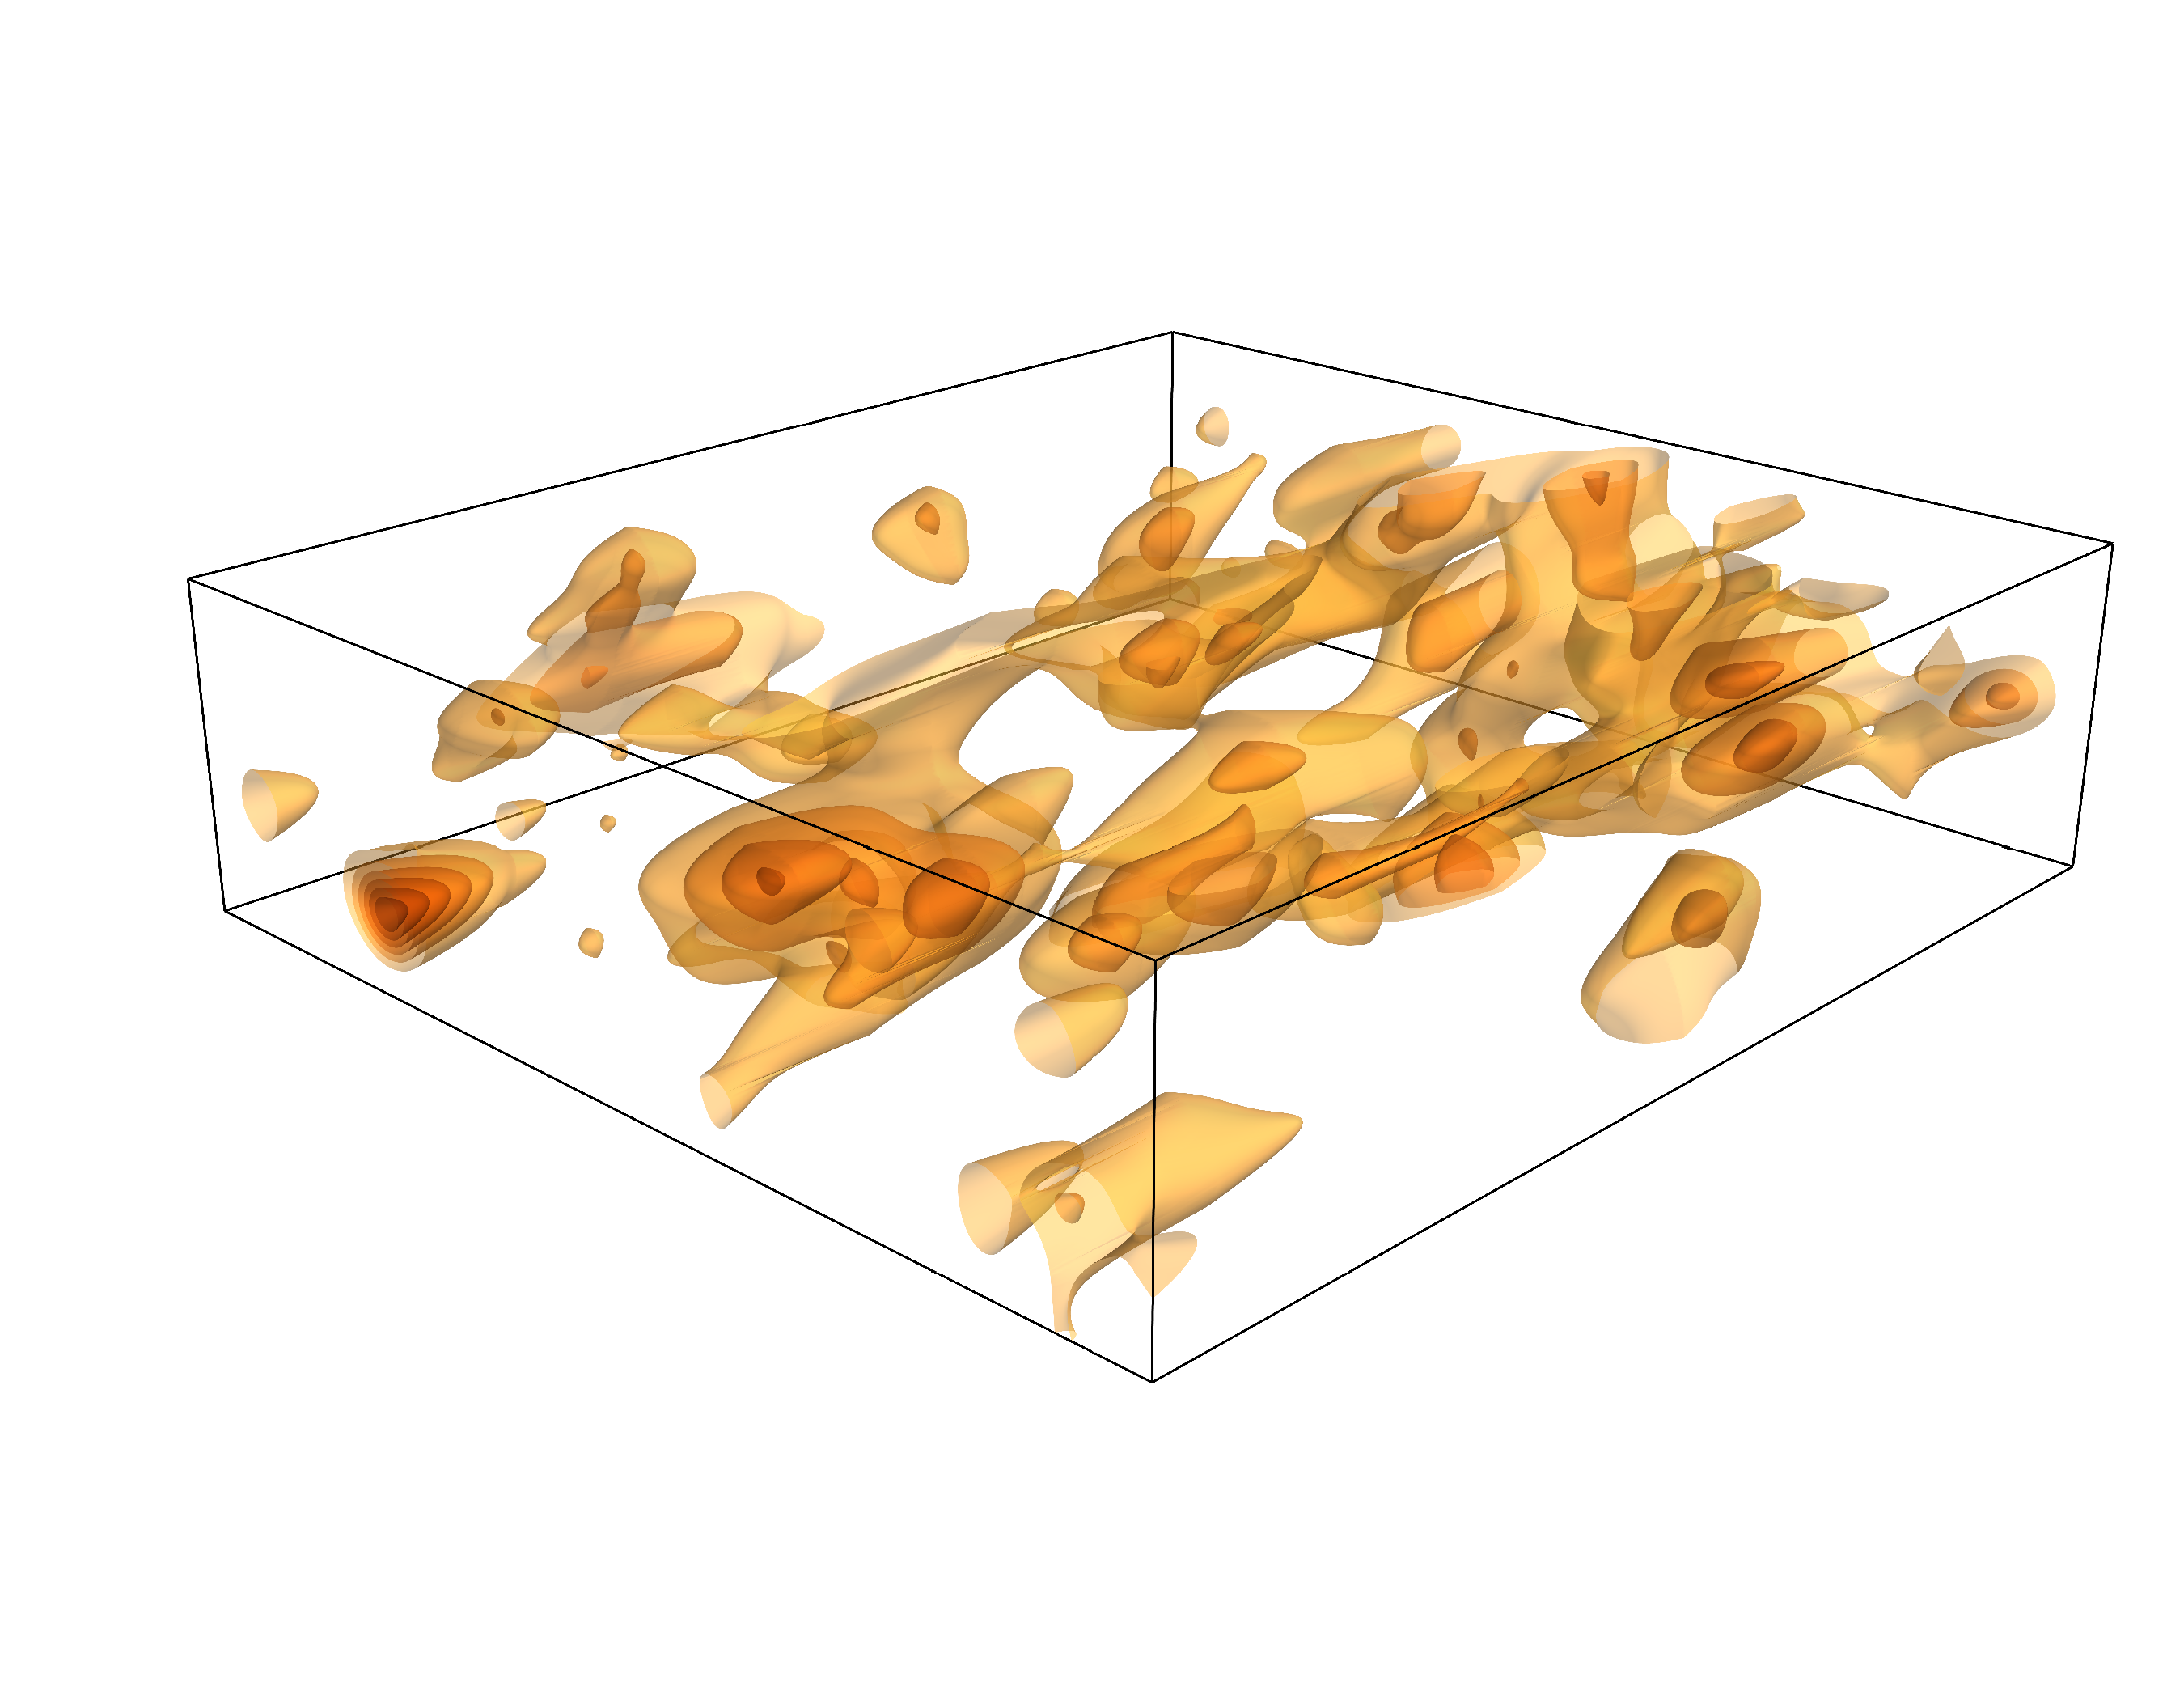
Paper: M. Oguri, et al. PASJ, 70, S26 (2018) Credit: U. Tokyo/NAOJ/M. Oguri |
The purple image shows three-dimensional mass (dark matter) map obtained from weak gravitational lensing analysis of Subaru Hyper Suprime-Cam (HSC) survey data. The red image shows three-dimensional galaxy (star) mass map in the same field. These maps are shown to be correlated statistically, which indicates that the mass reconstruction with weak gravitational lensing is successful. This represents the largest three-dimensional dark matter map ever created. In visualizing the maps, I got great help from Yousuke Utsumi who is a coauthor of the paper. The version without label is available here and here, and three-dimensional maps in other patches are available here. |
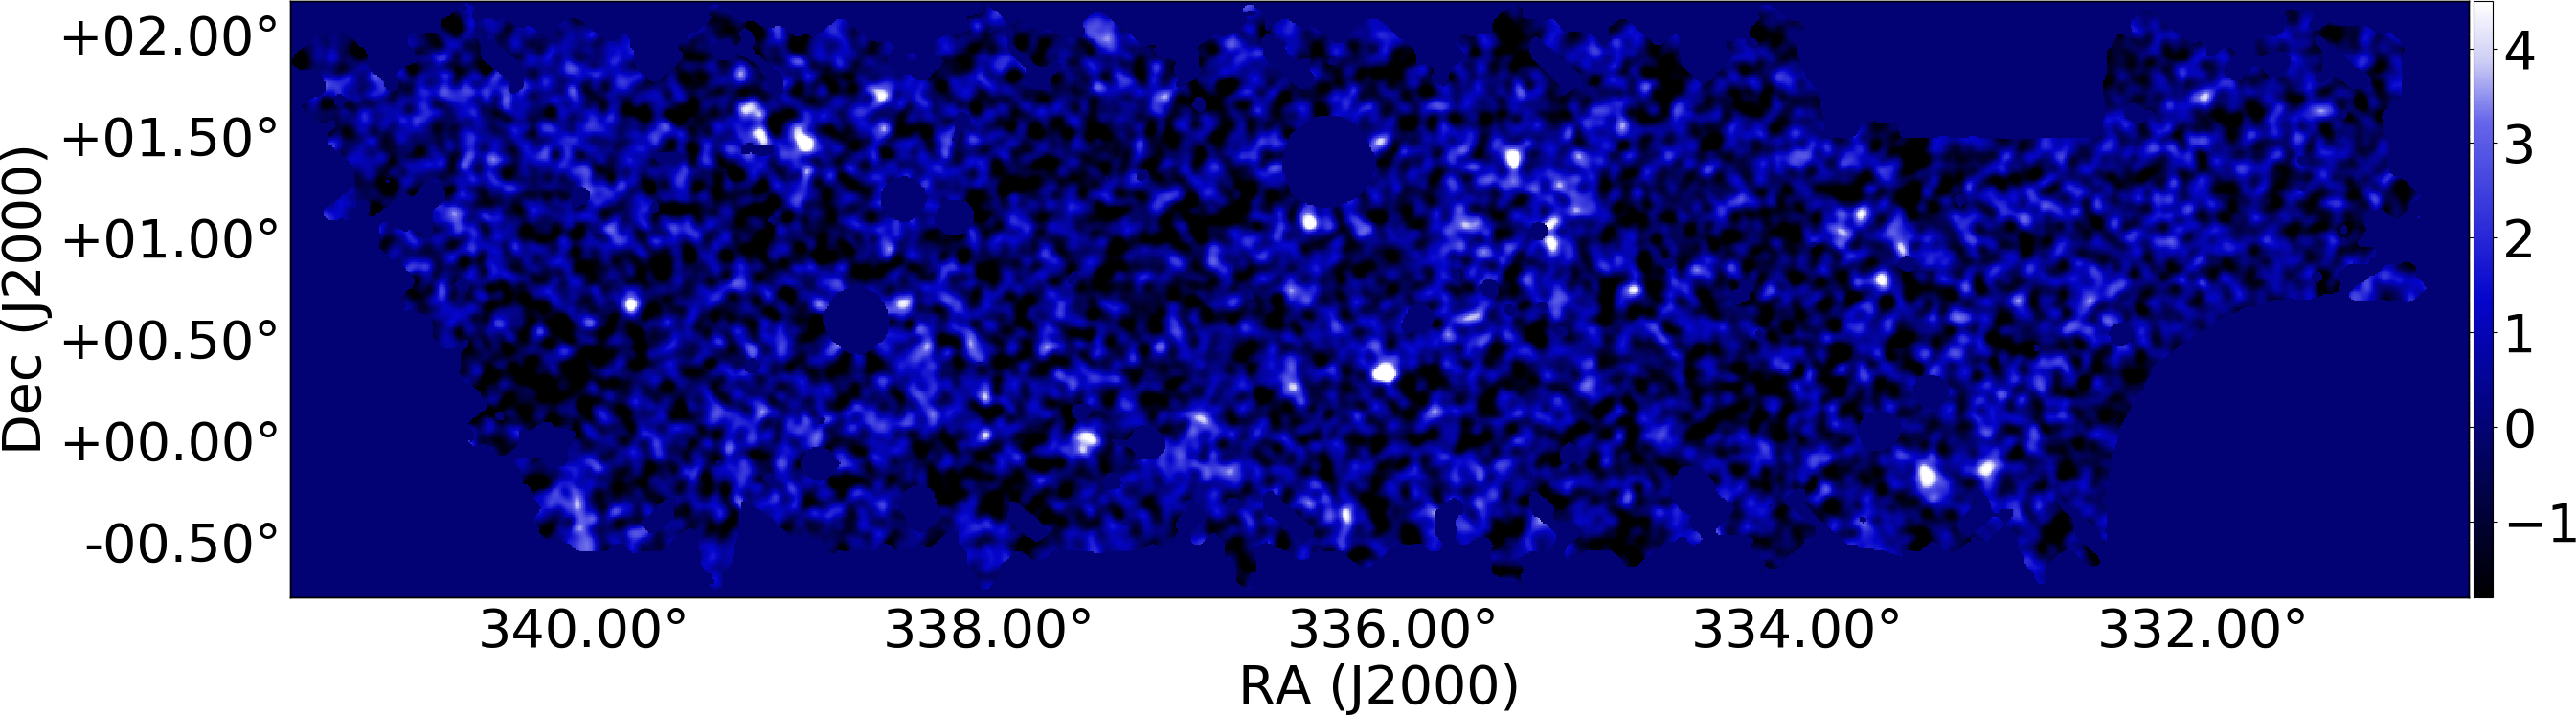 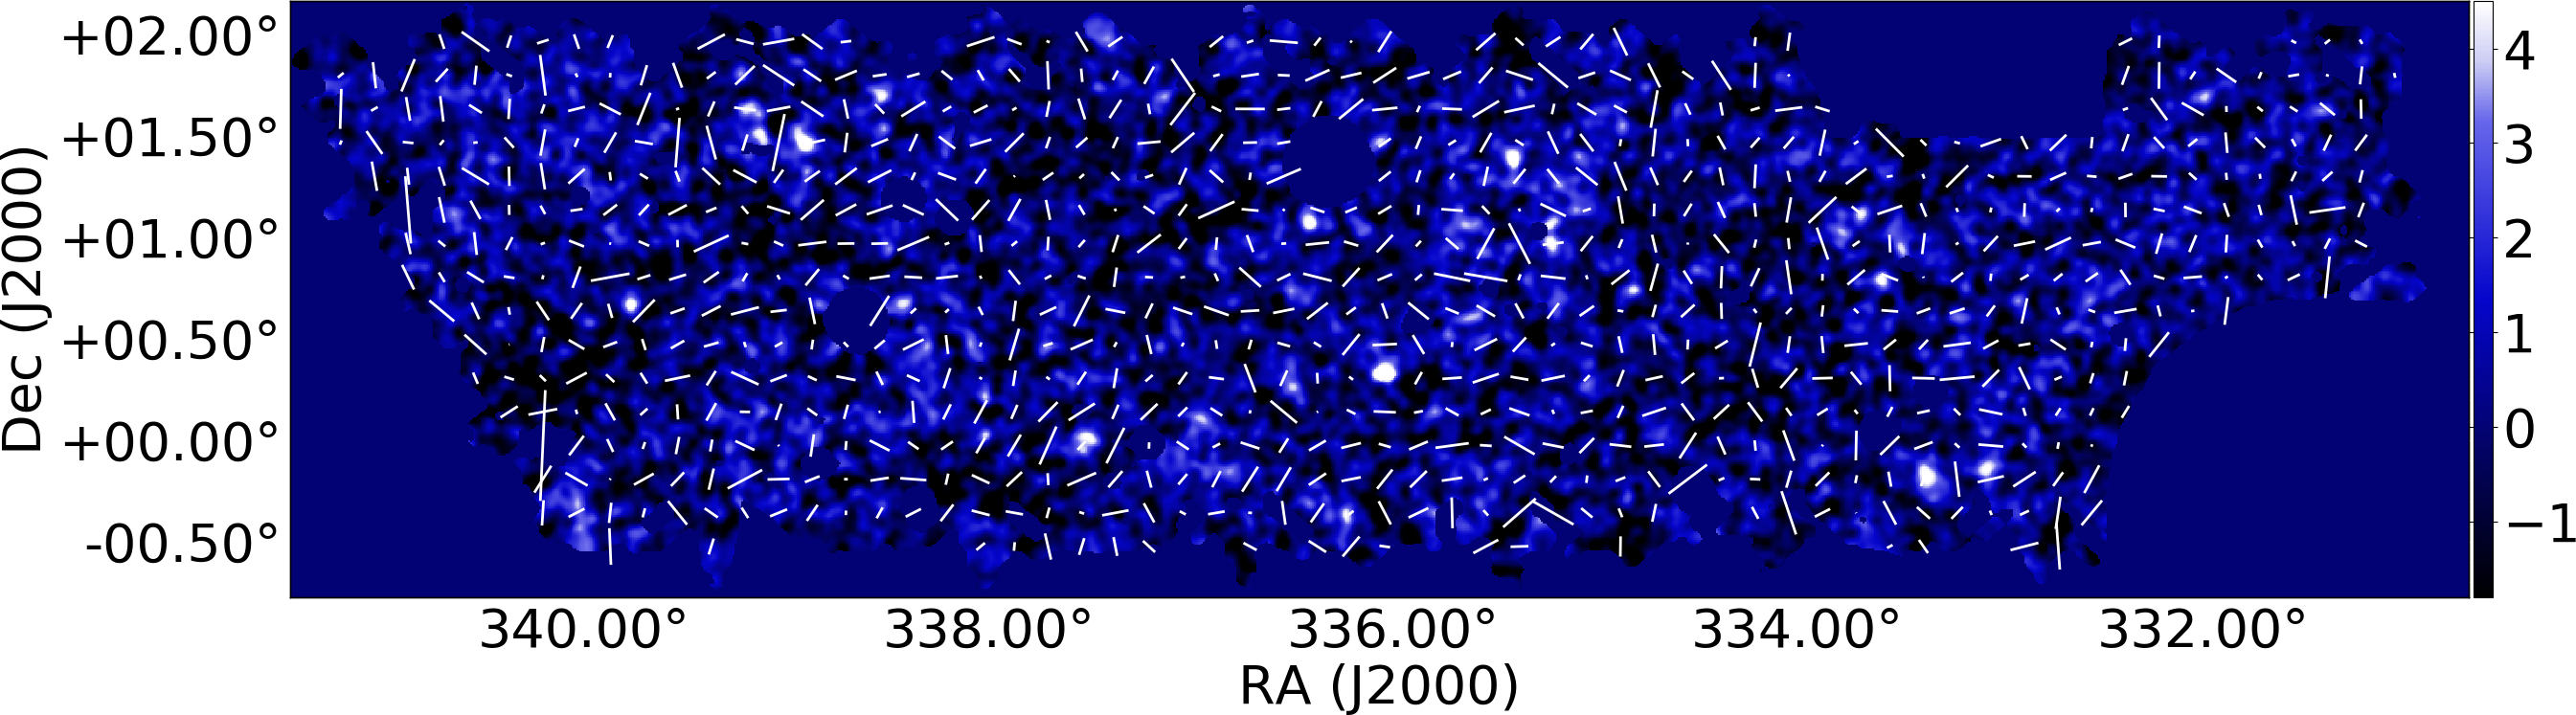  |
Paper: M. Oguri, et al. PASJ, 70, S26 (2018) Credit: U. Tokyo/NAOJ/M. Oguri |
As in the images above, two-dimensional mass (dark matter) map (blue) and galaxy mass map (red) are derived with weak gravitational lensing analysis of Subaru Hyper Suprime-Cam (HSC) survey data. It is clear that these two maps are correlated with each other. For the dark matter map, I also created a version with gravitational lensing shear map is overlaid. The shear map shows a tangential pattern around the concentration of dark matter. As for three-dimensional maps, I created two-dimensional maps in other patches, which are available here. |
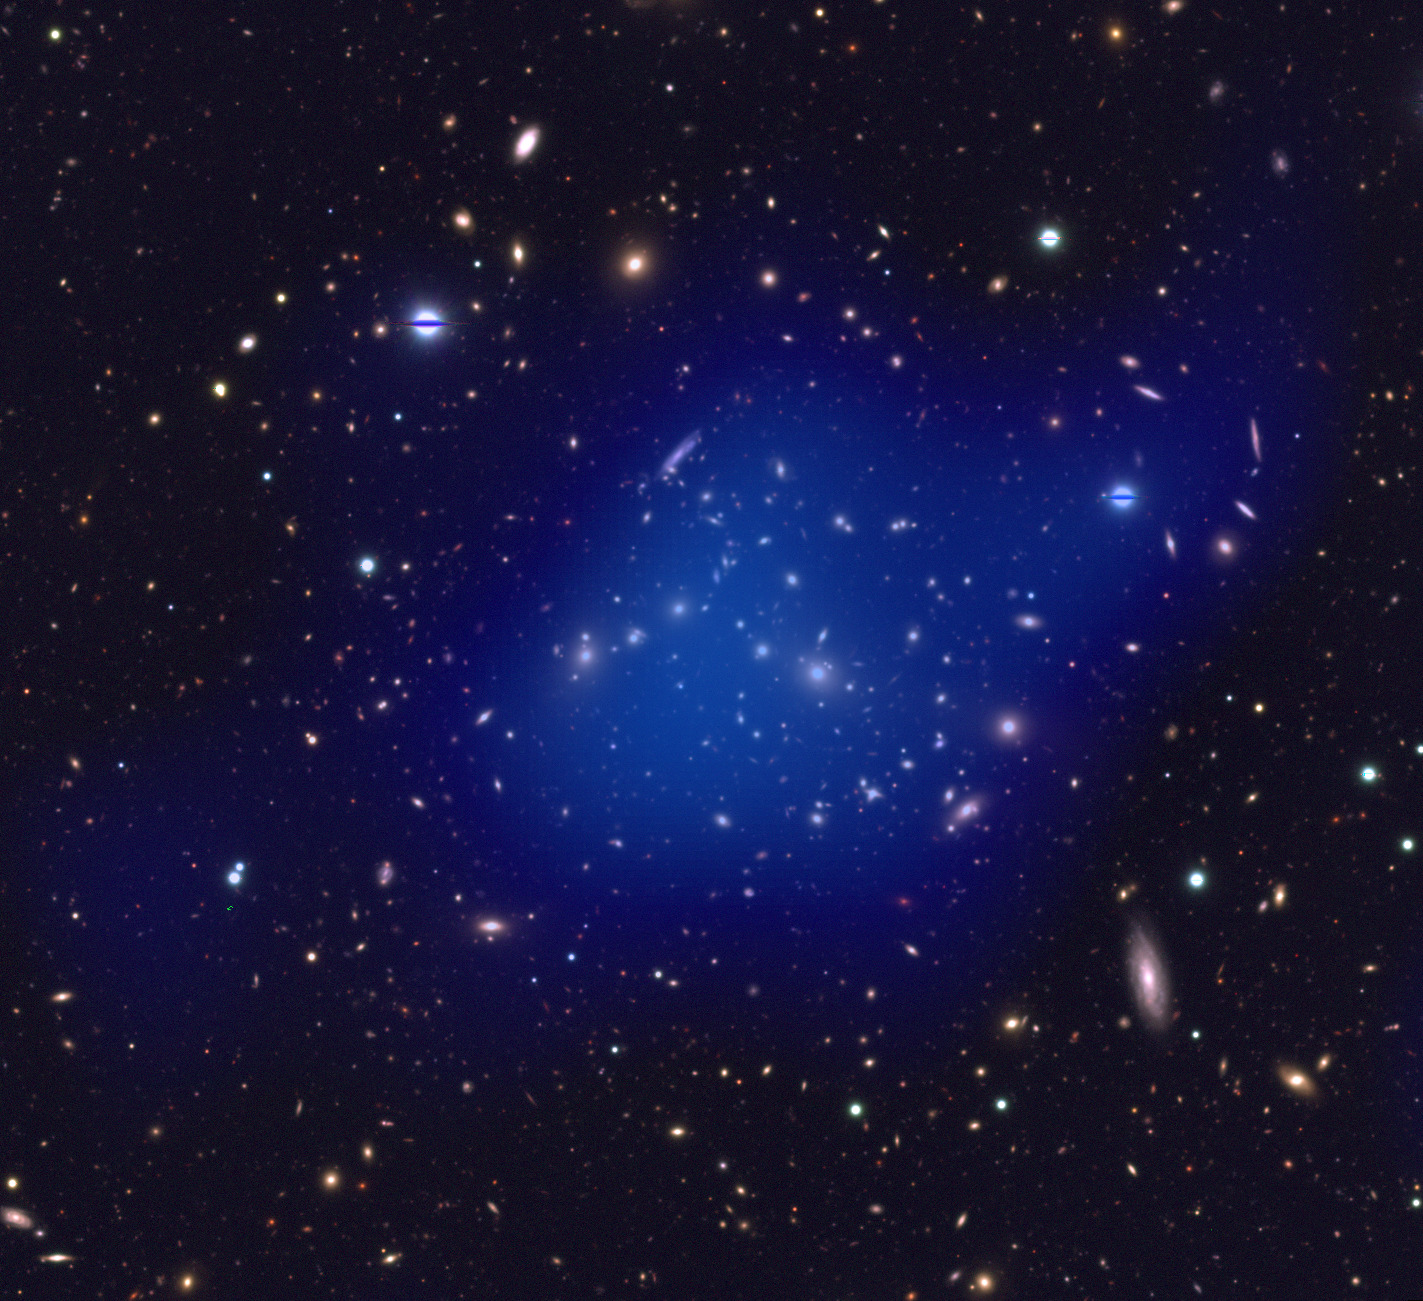 |
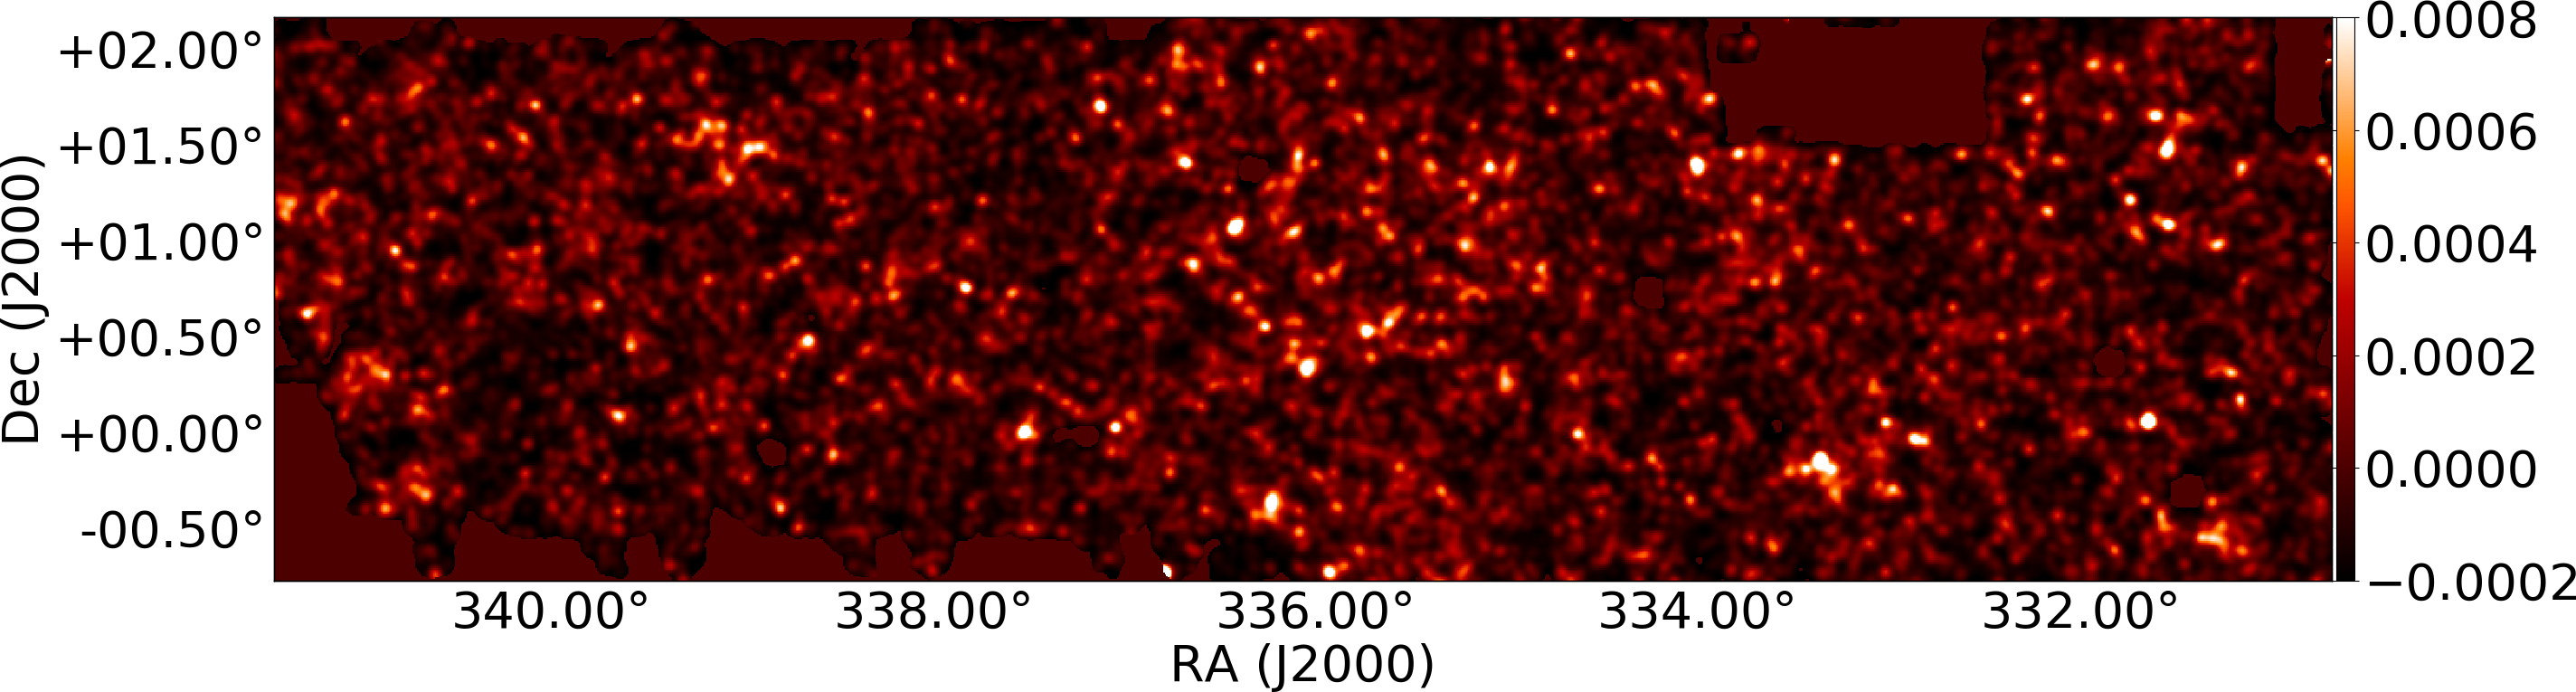
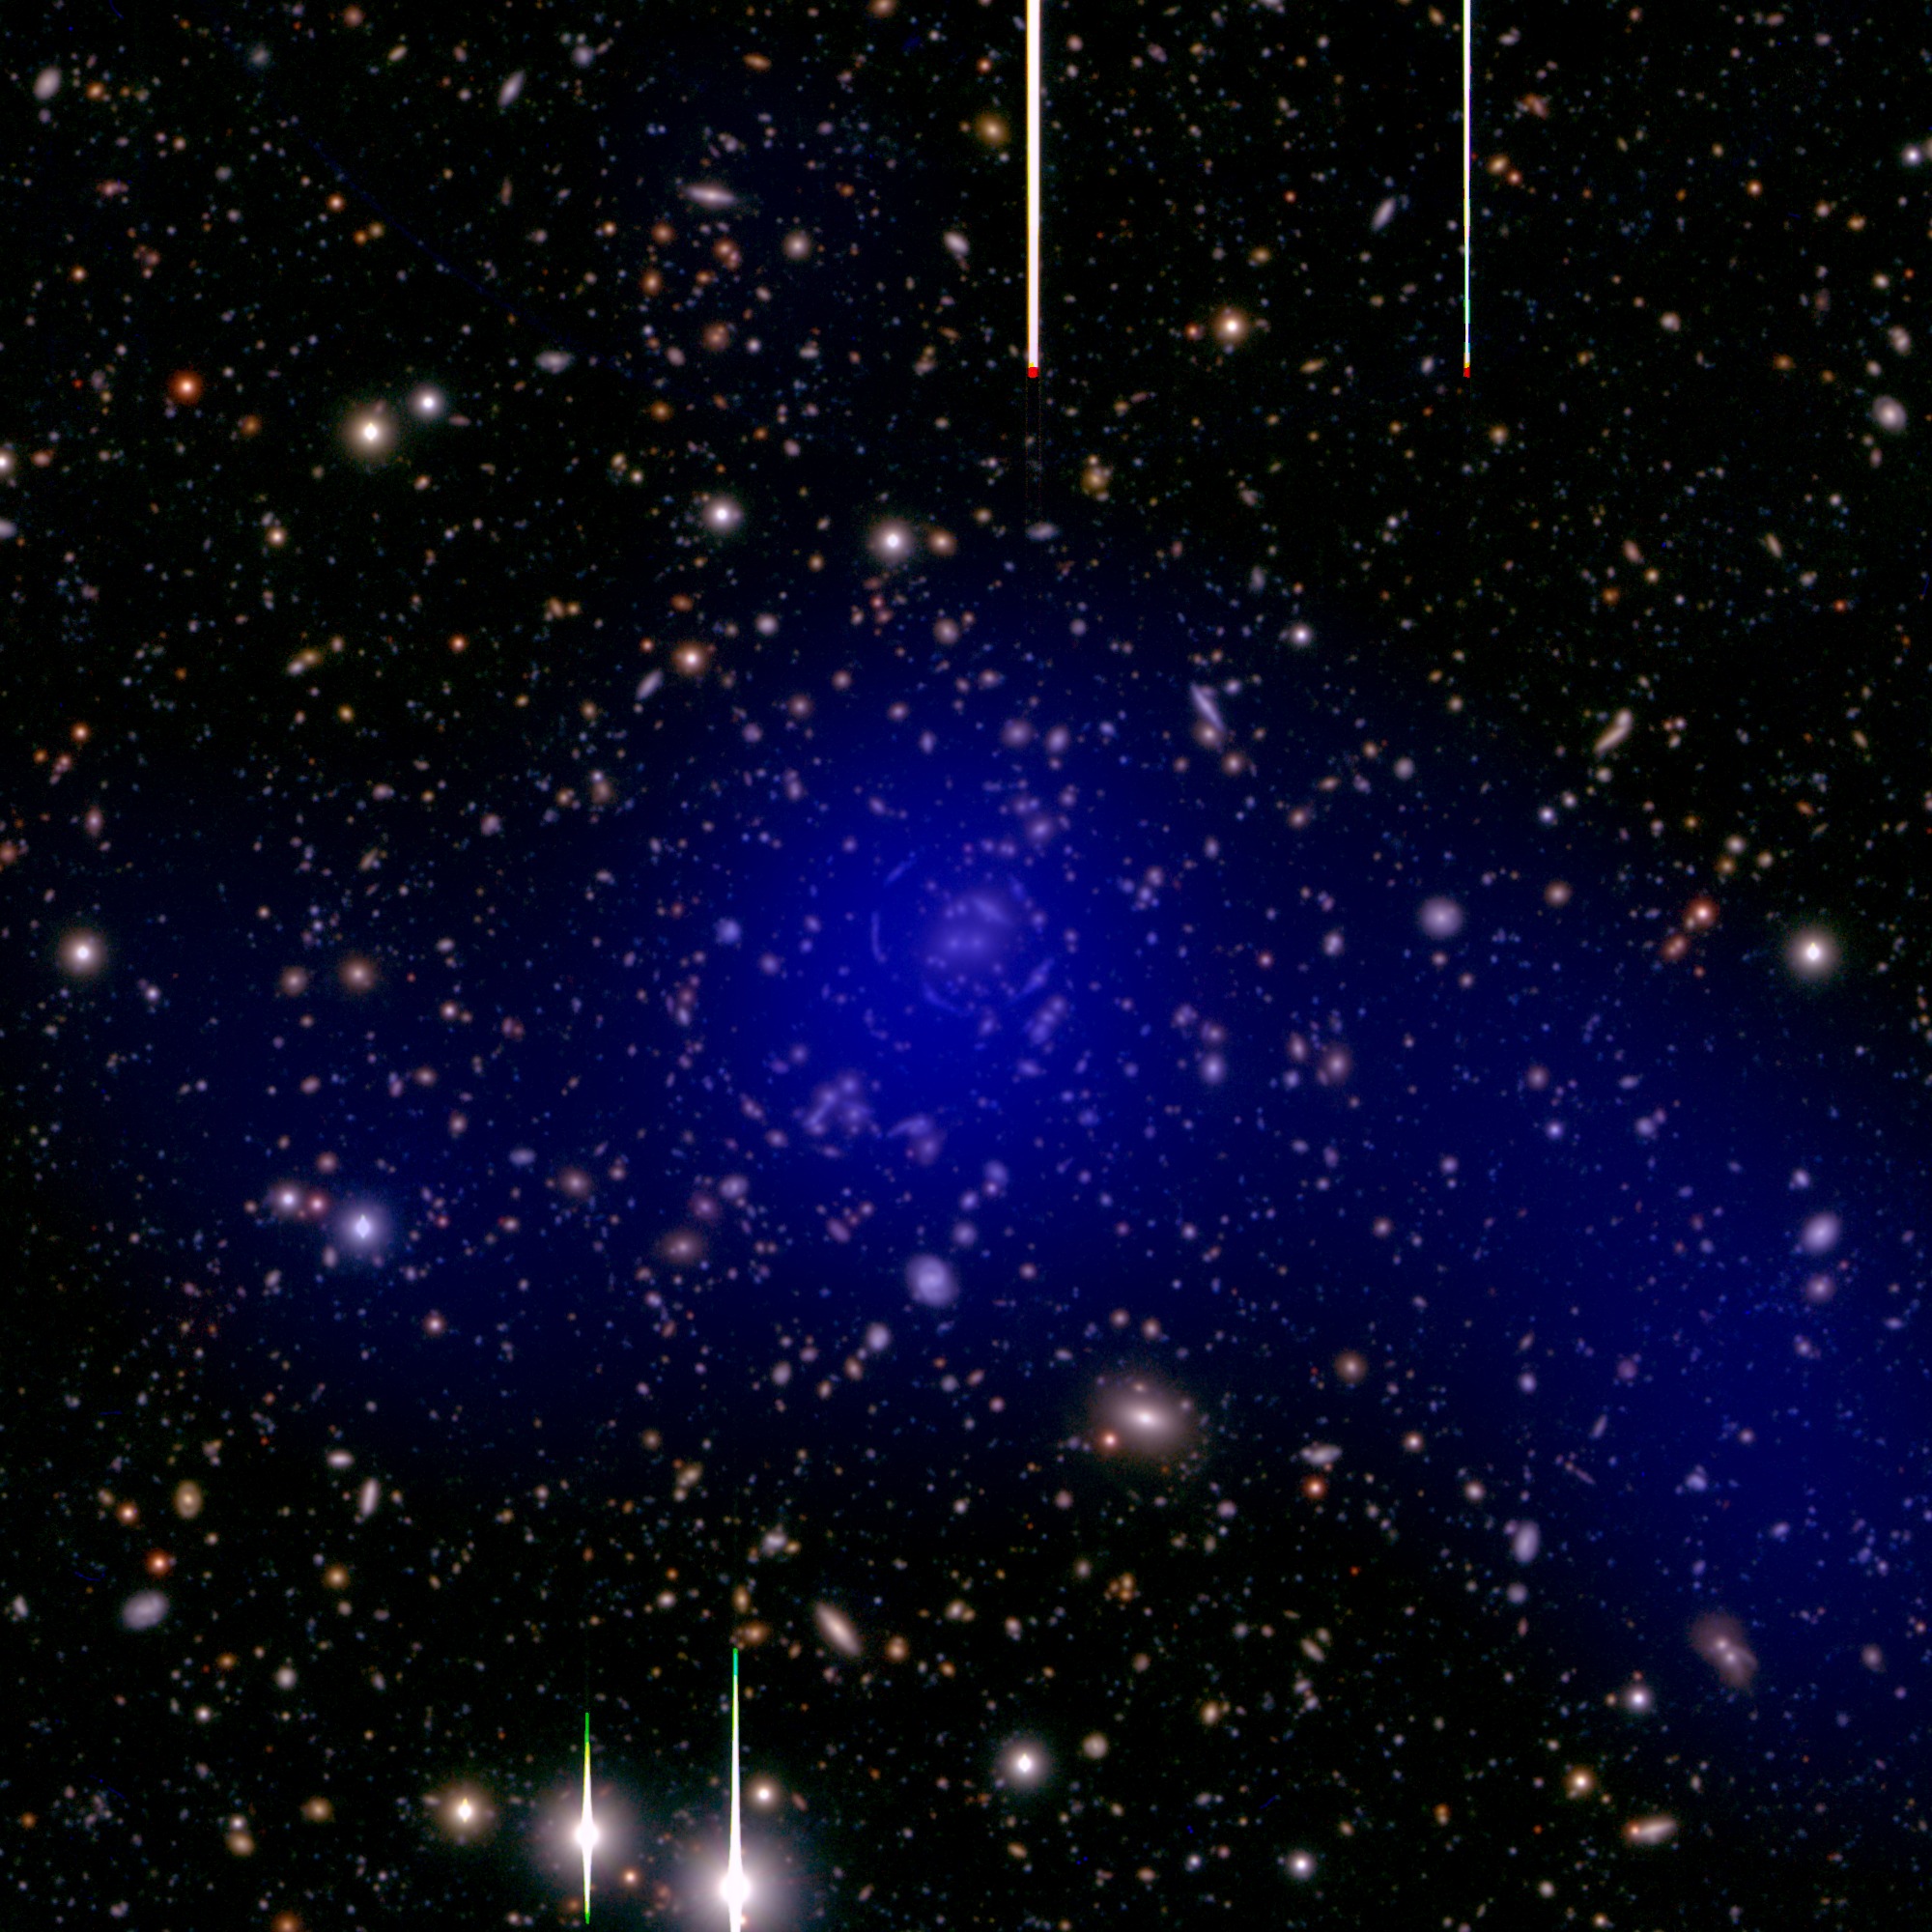
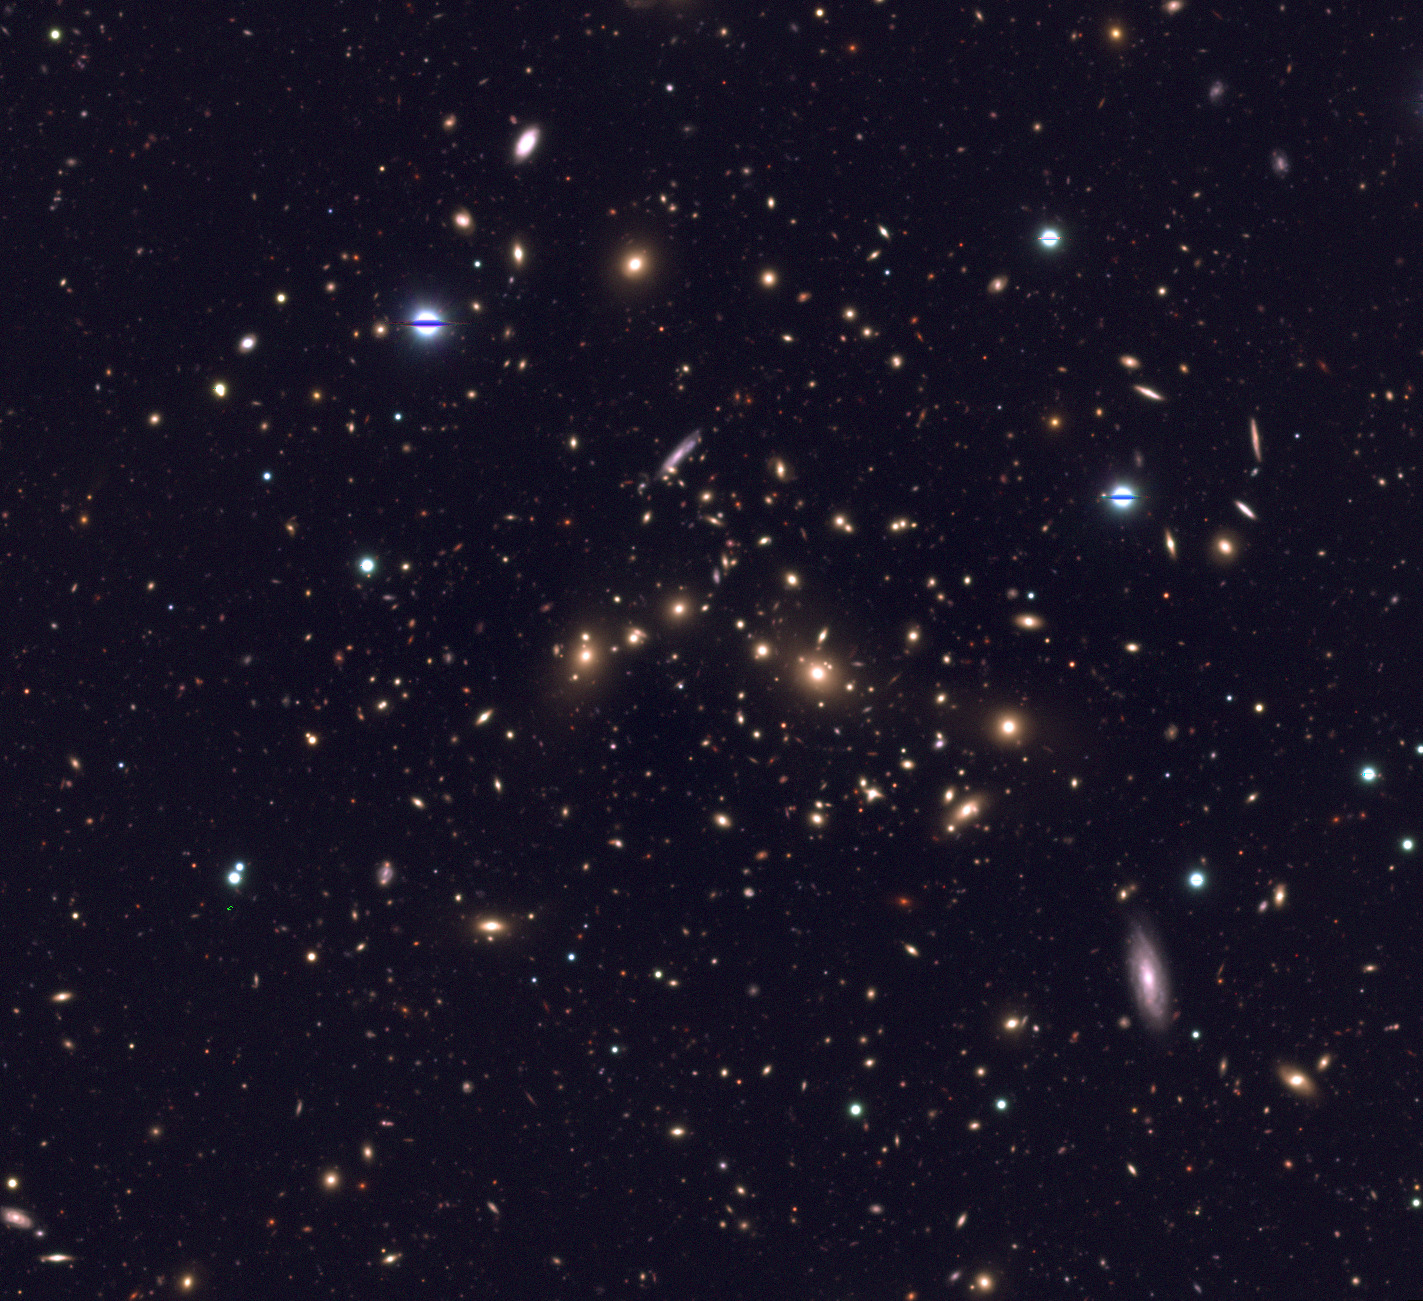
Paper: M. Oguri, et al. PASJ, 70, S26 (2018) Credit: U. Tokyo/NAOJ/M. Oguri |
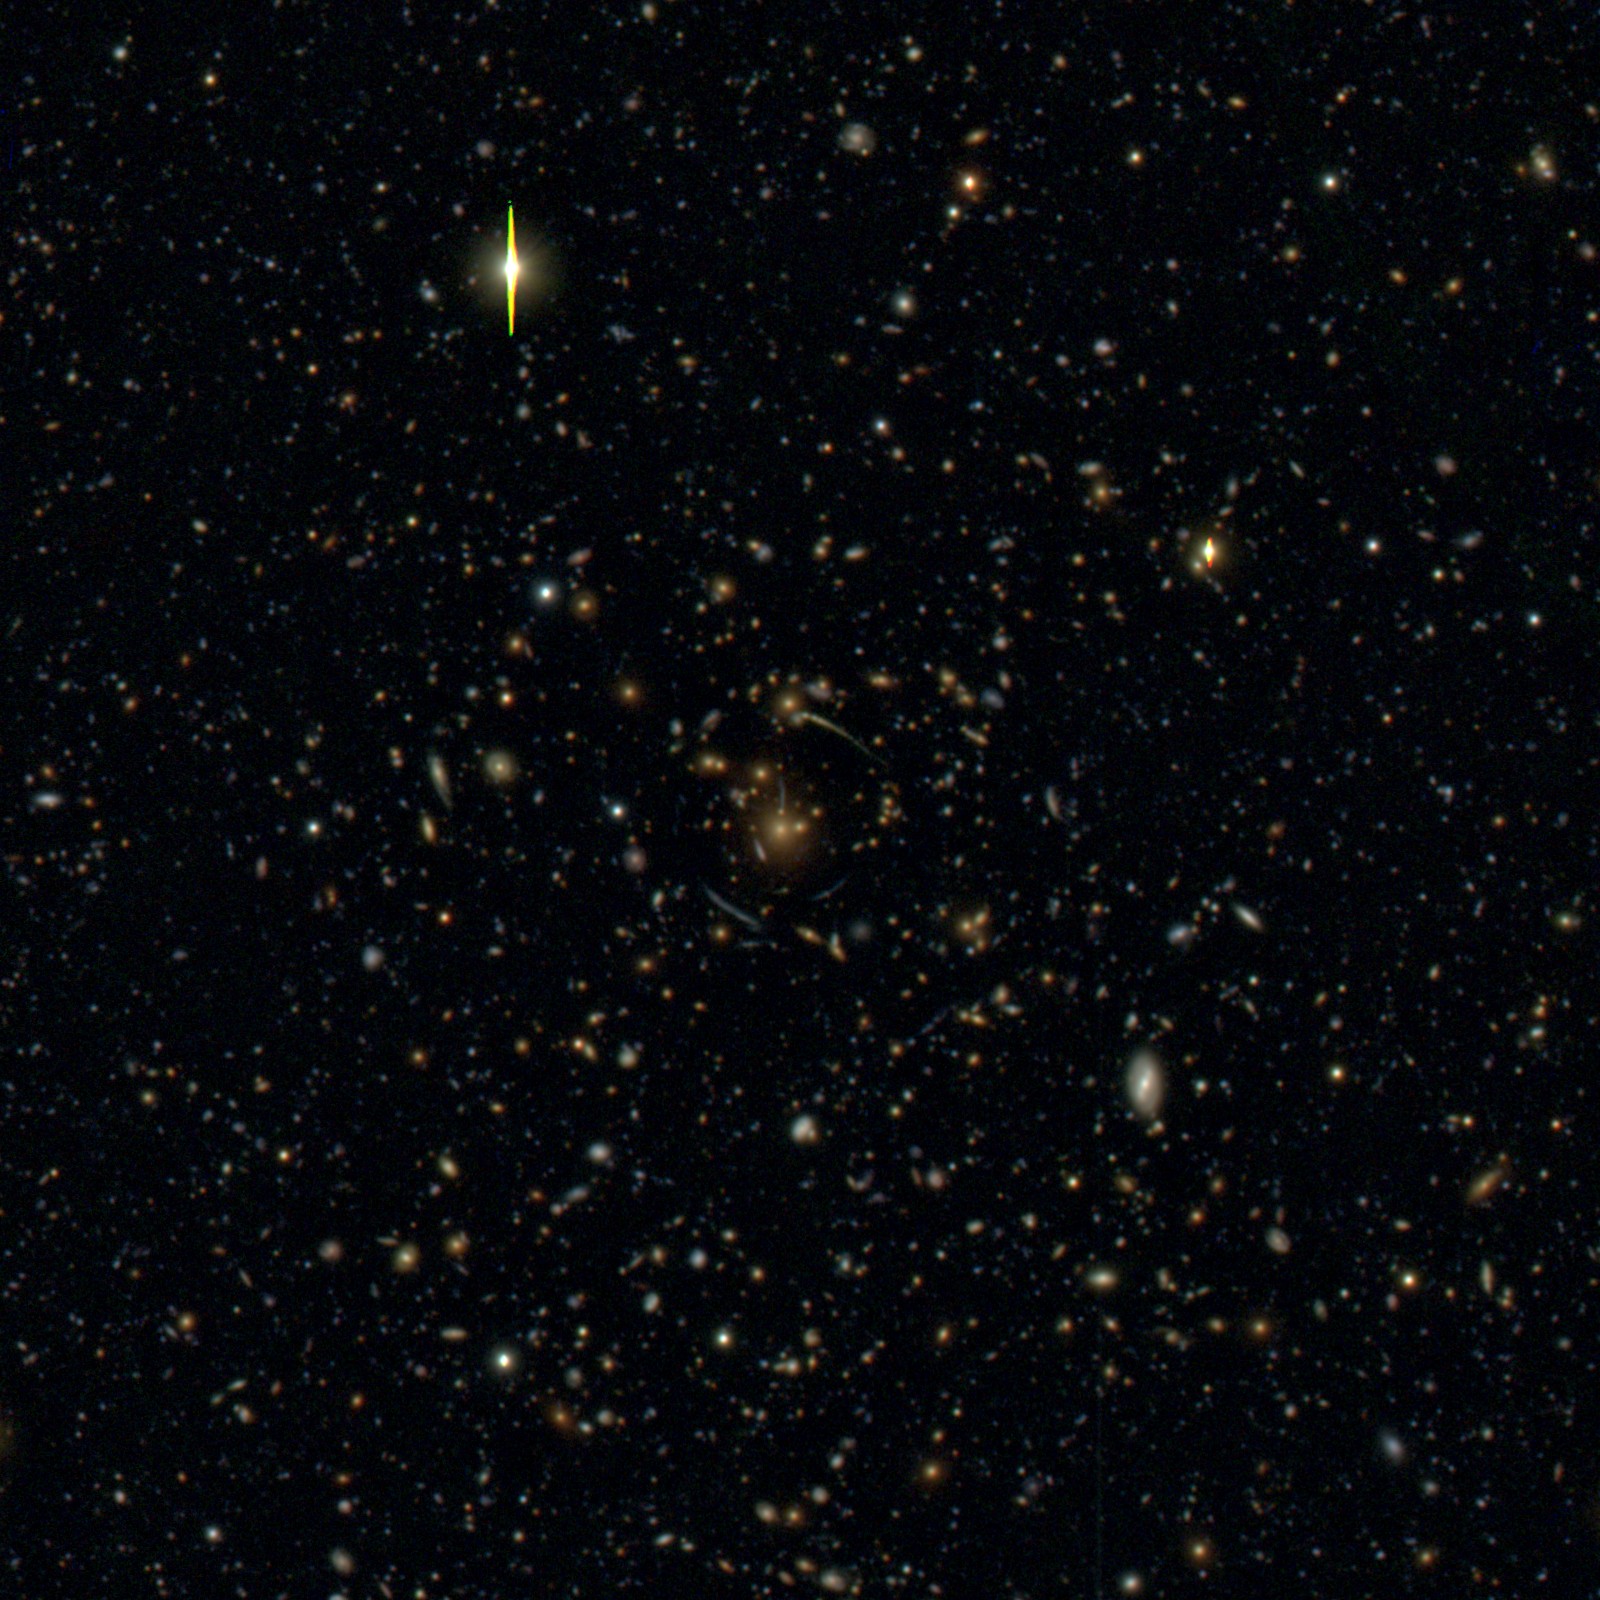
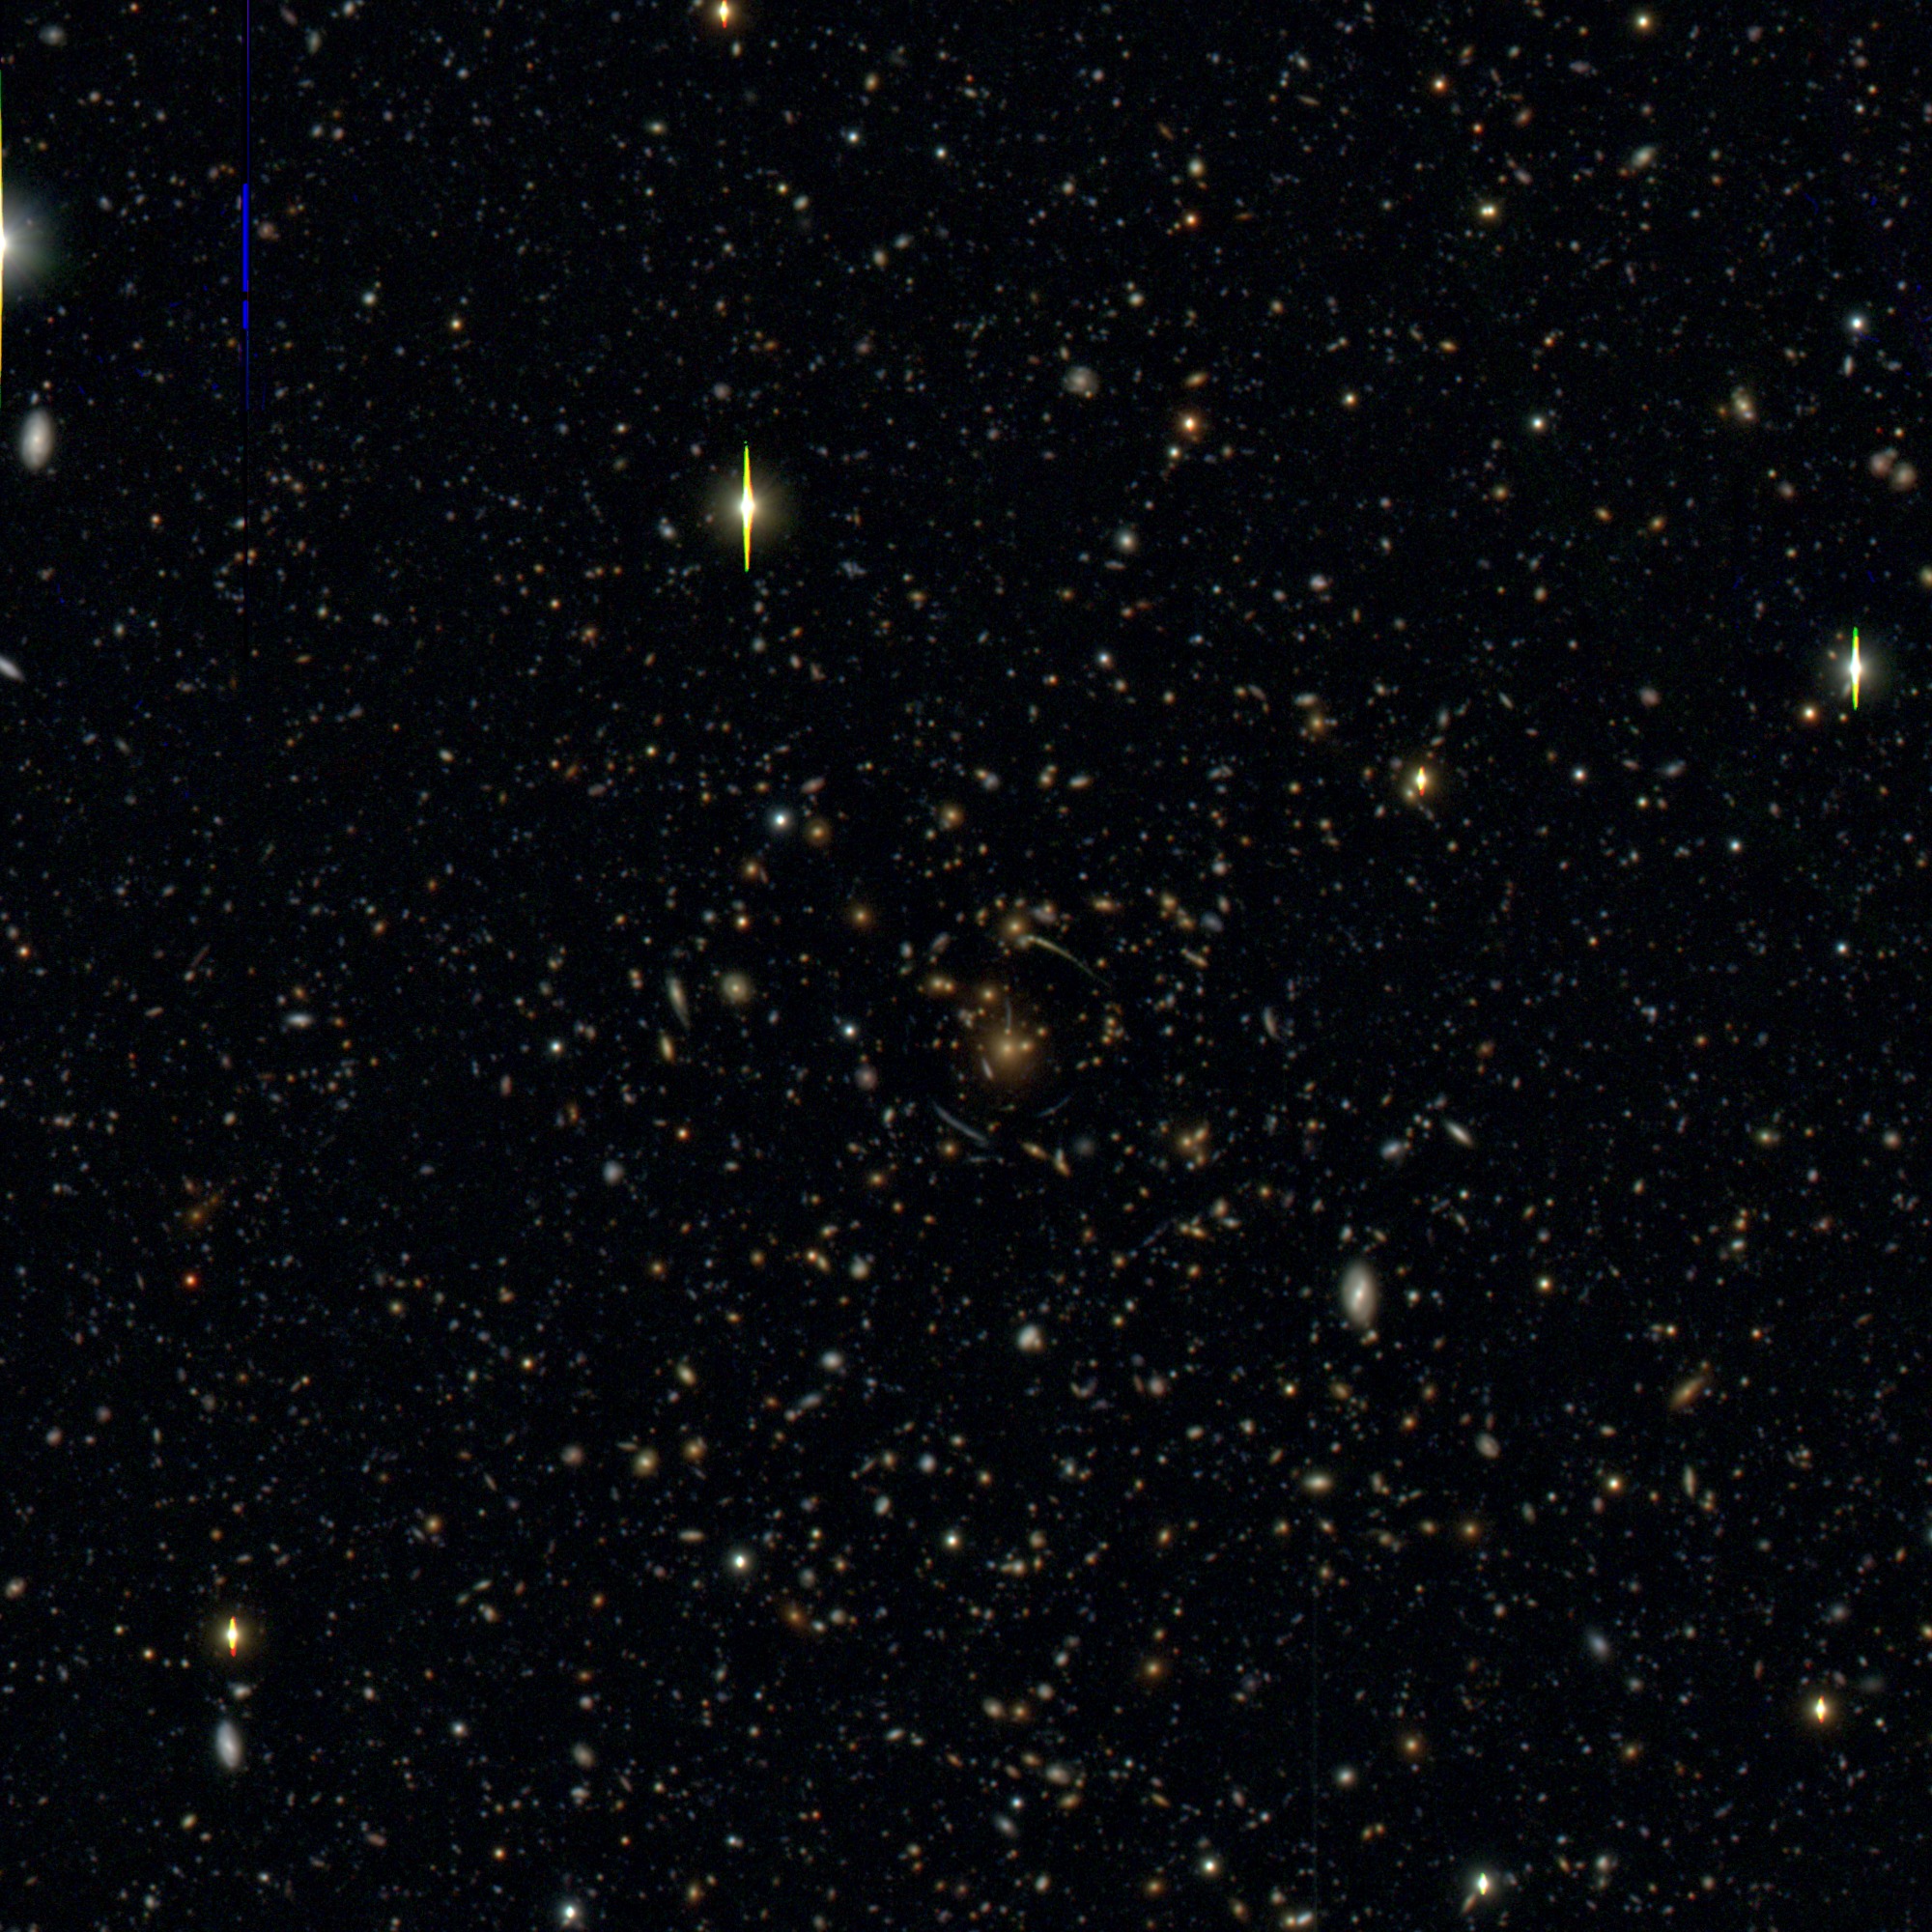
The color-composite image of Subaru Hyper Suprime-Cam survey around one of the most weak lensing significant clusters, along with dark matter distributions inferred from weak gravitational lensing analysis (blue). The version without dark matter distribution is available here. |
  |
Credit: M. Oguri | Our team recently reported the discovery of the farthest star ever seen, which made use of caustic crossing in gravitational lensing. These gif animations were created to explain caustic crossing (lower), which differs from traditional microlensing (upper). The light curve of the traditional microlensing has a symmetric shape around the peak, whereas that of caustic crossing is highly asymmetric. These animations were created using glafic, which is a public software developed by myself. I also used gif animations by Scott Gaudi as a reference, and followed the structure of his animations to create animations of my own version. |
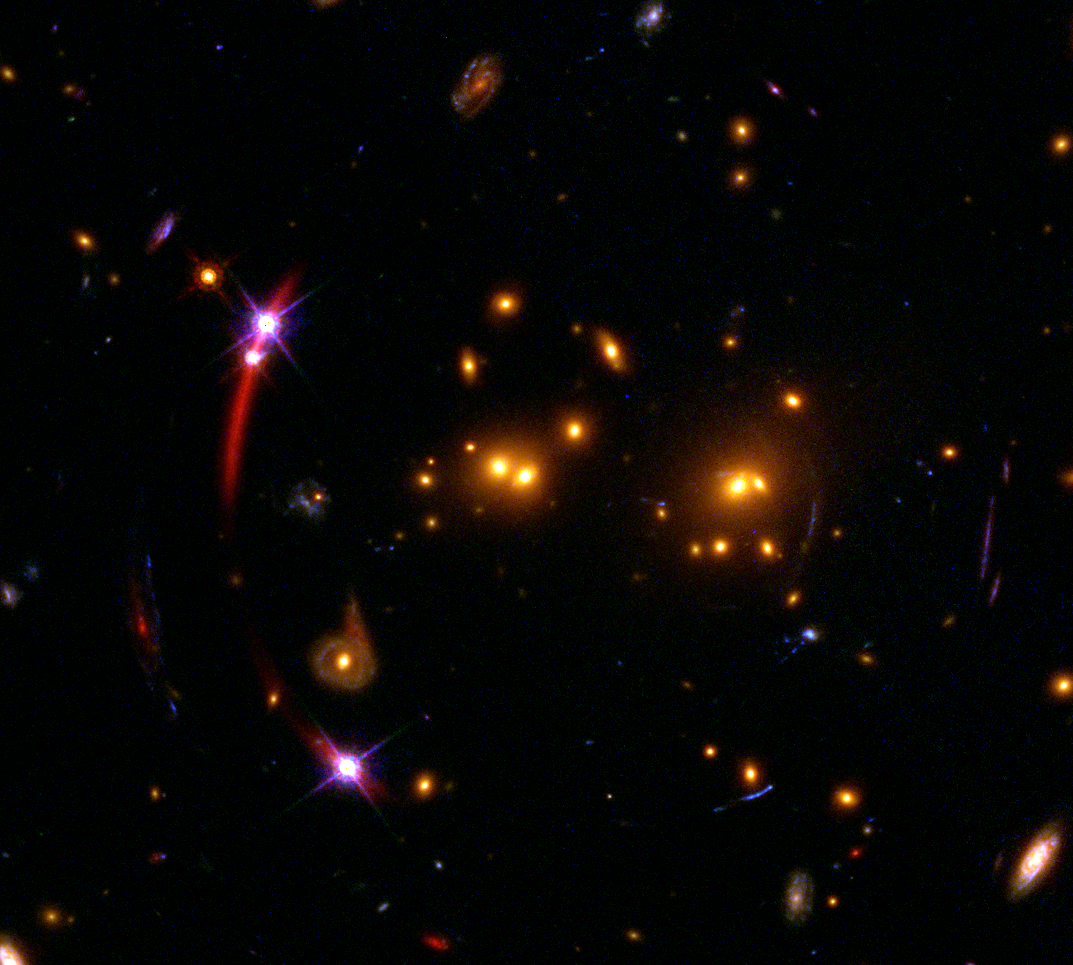 |
Paper: M. Oguri, et al. MNRAS, 429, 482 (2013) Creadt: NASA/ESA/M. Oguri |
The Hubble Space Telescope image of SDSSJ1029+2623, which is the largest-separation (22 arcseconds) gravitationally lensed quasar discovered in SDSS by our group. Three blue point sources on the left side of red cluster member galaxies are three lensed images of a single quasar. Behind the quasar images, we can also see a lensed quasar host galaxy. This quasar lens system is dubbed as the Hidden Fortress. |
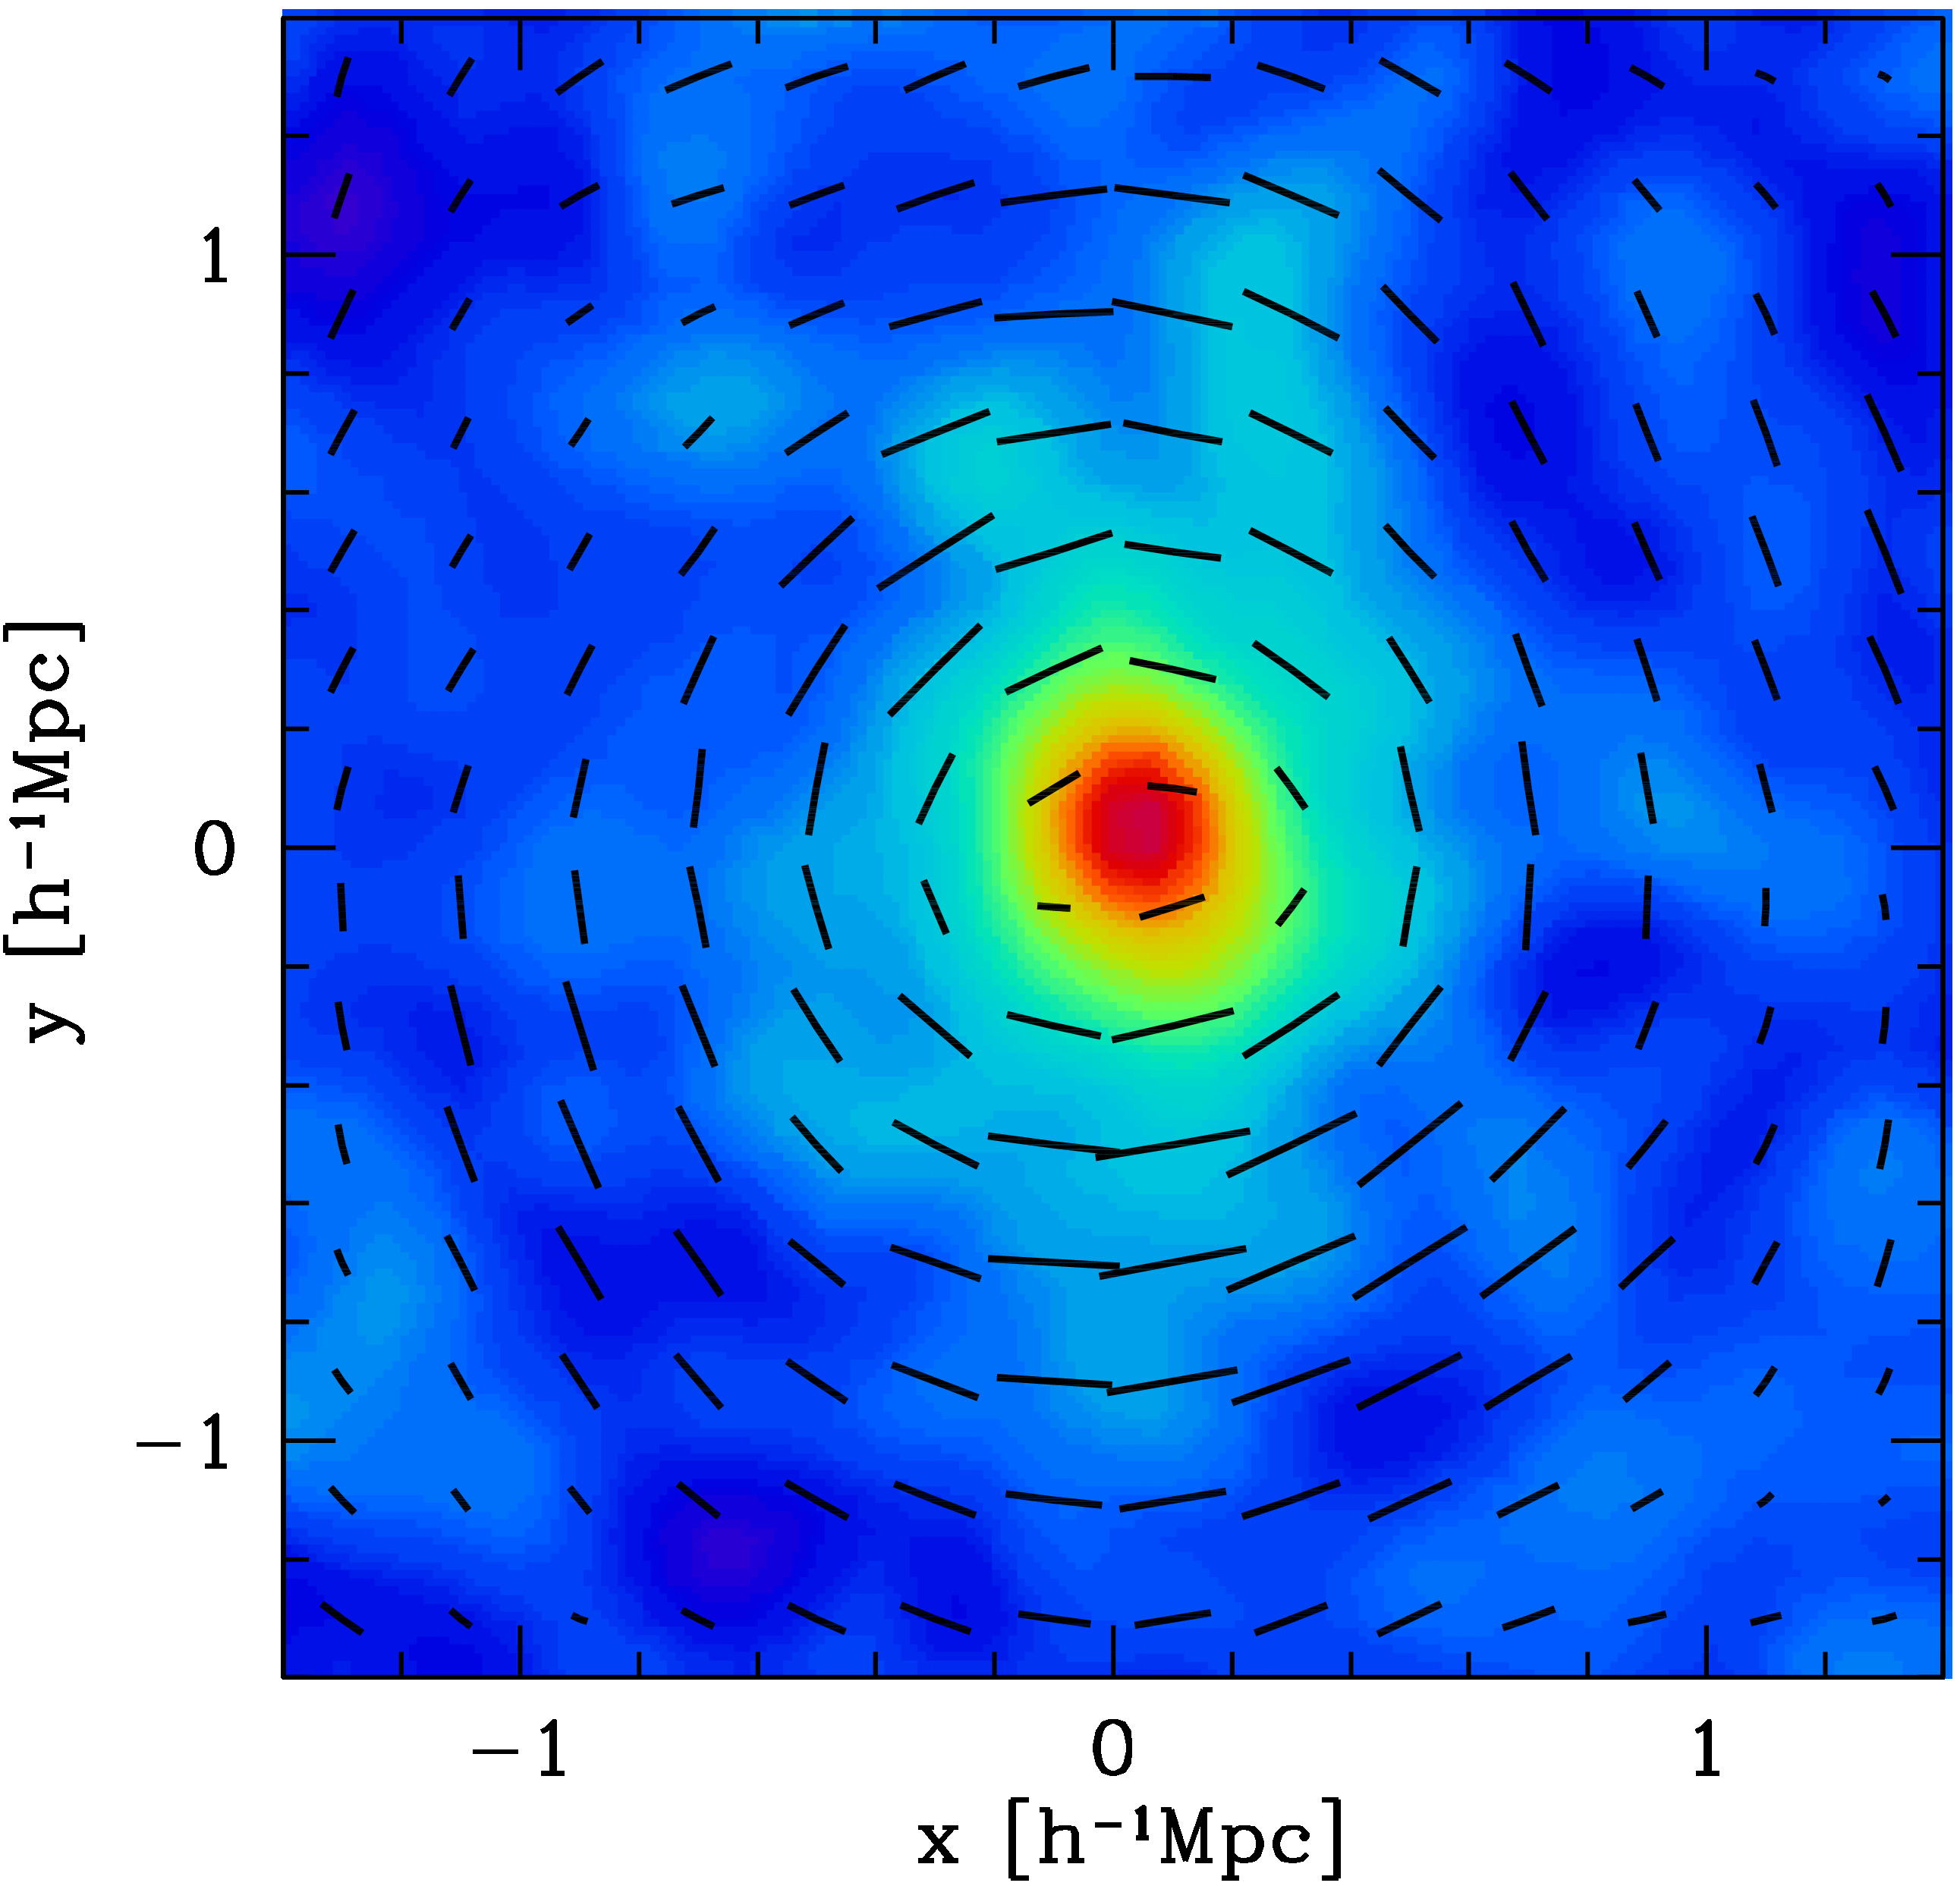 |
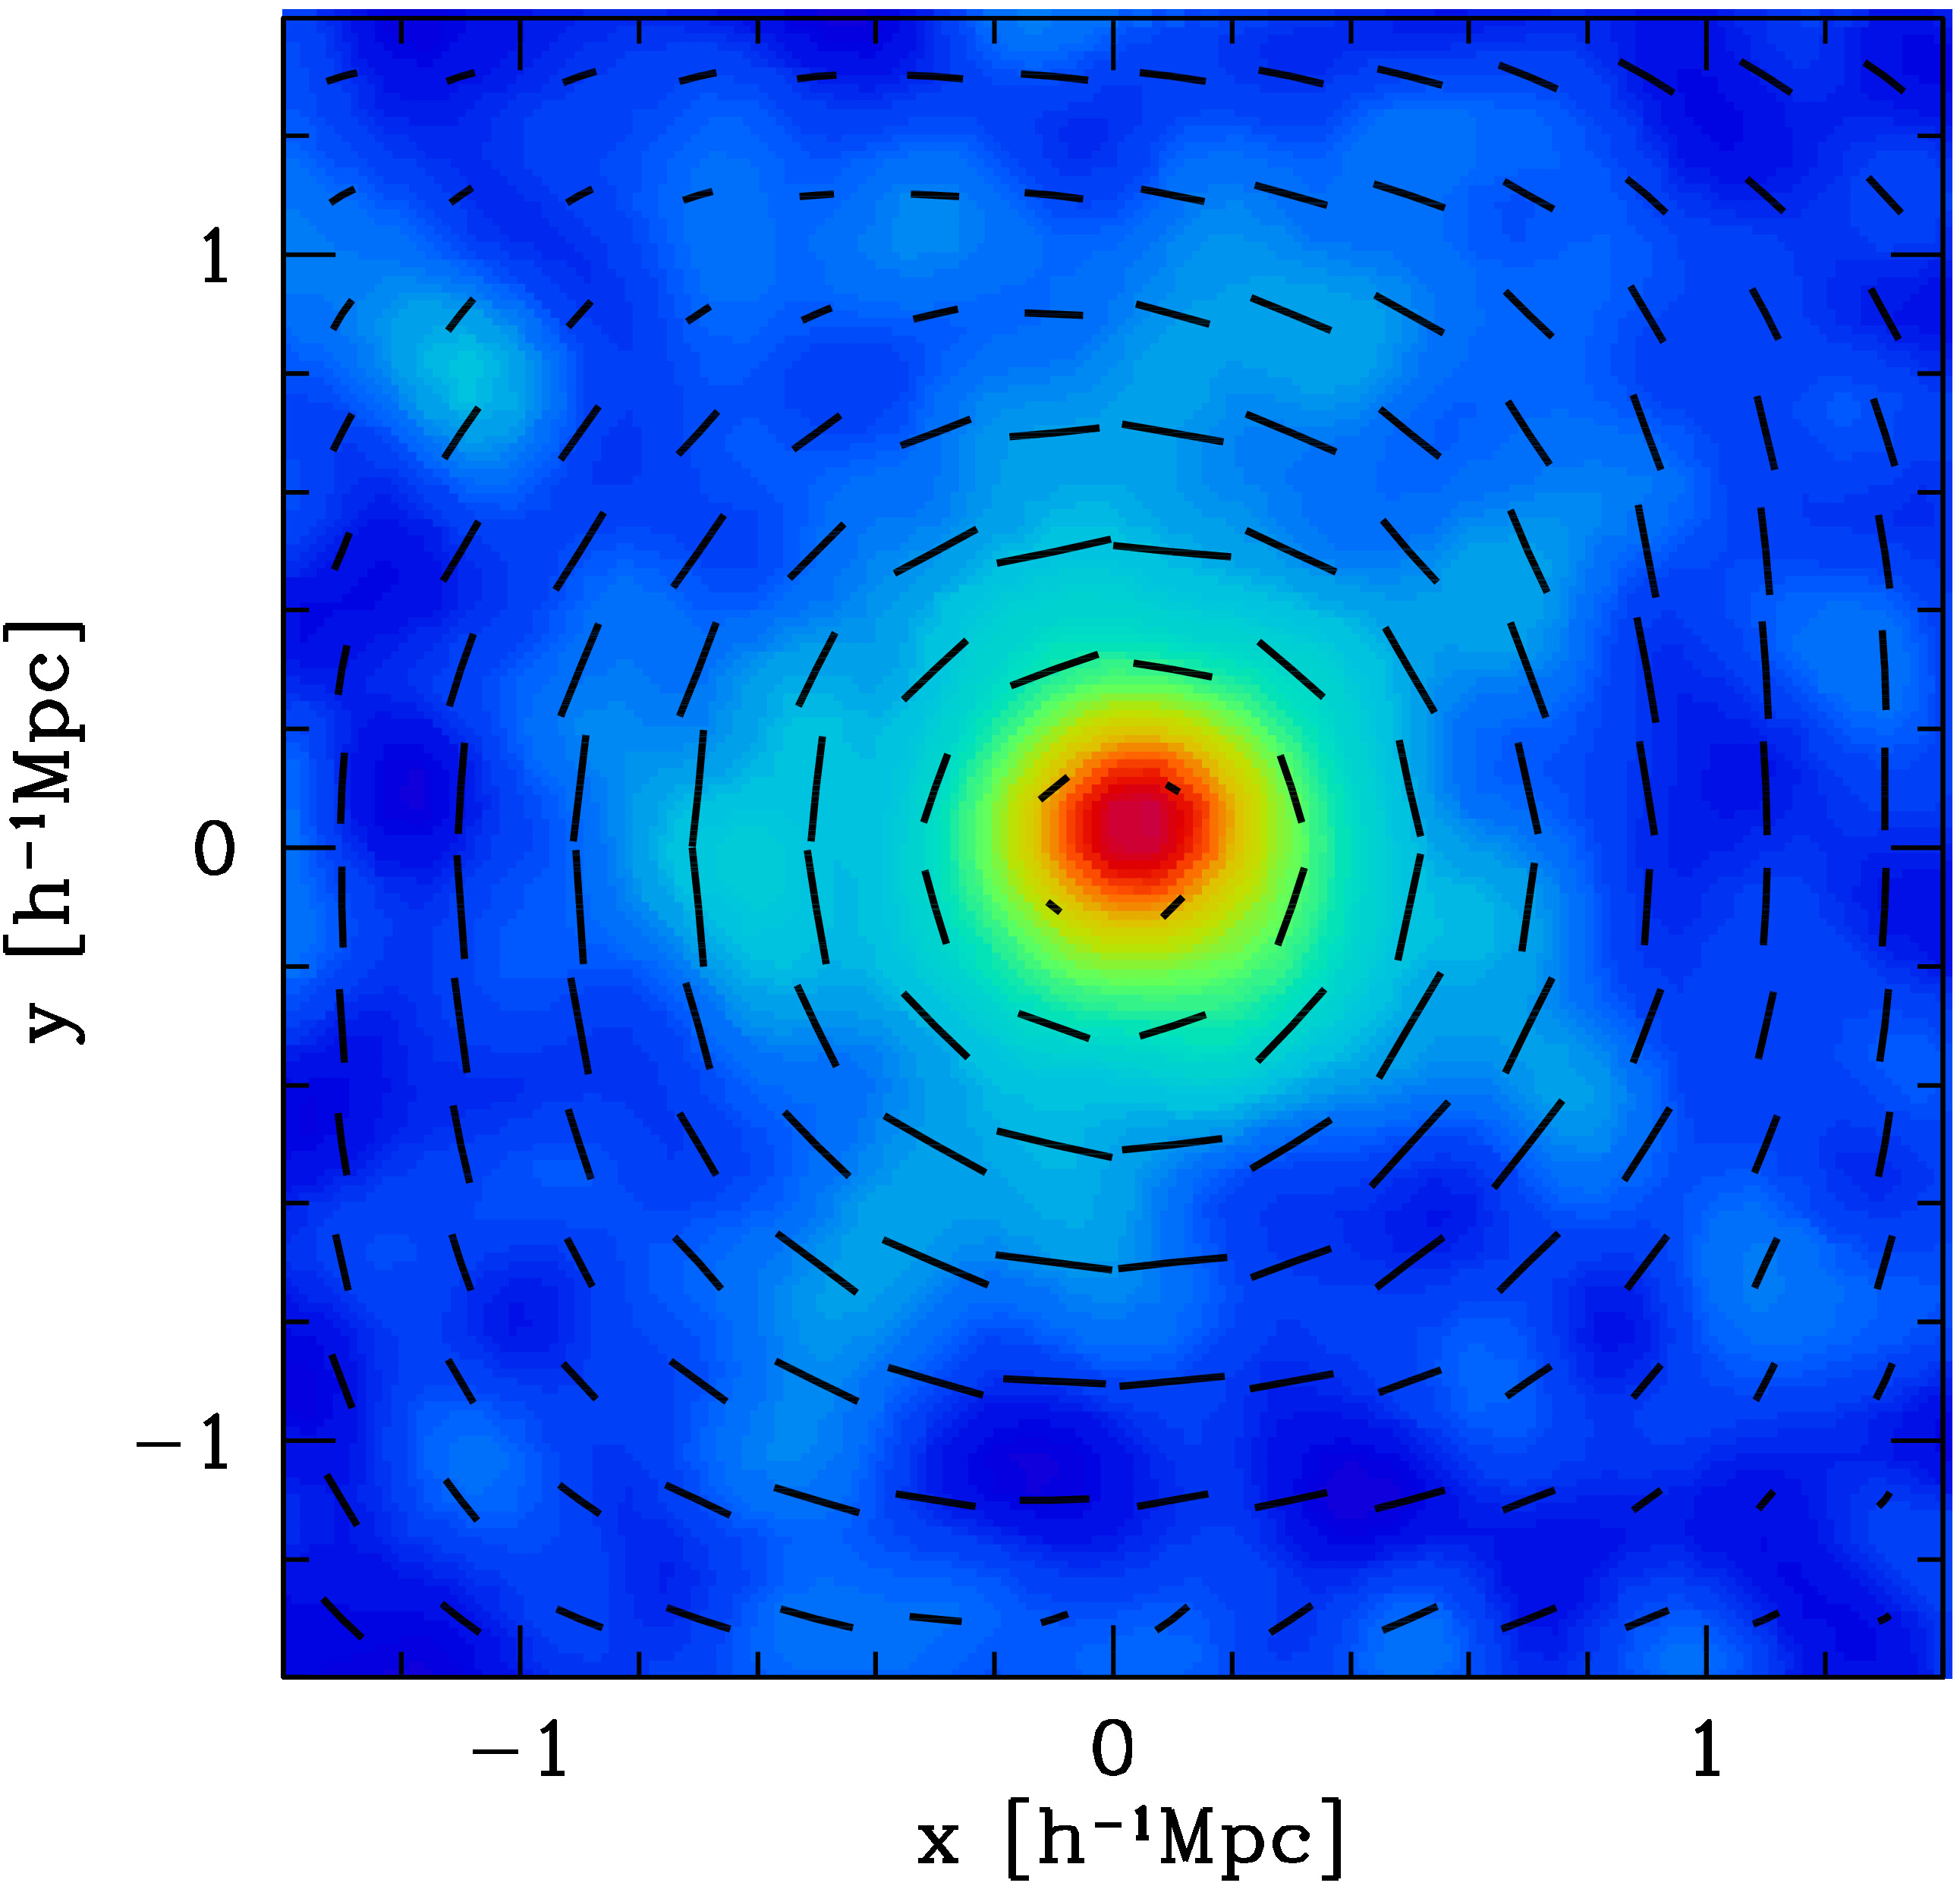
Paper: M. Oguri, et al. MNRAS, 420, 3213 (2012) |
Average mass distribution around clusters of galaxies, which was obtained by stacking weak gravitational lensing signals around 25 clusters. The red region indicates the high density region, and bars indicate gravitational lensing shear map that was used to reconstruct the mass distribution. In stacking we align orientations of clusters along North-South direction, and as a result reconstructed dark matter distribution deviates significantly from spherical symmetry and exhibits highly elongated distribution. In our paper in 2010 and 2012, strong direct evidence of elongated dark matter distribution in clusters of galaxies was obtained for the first time. The version of stacking without aligning orientations is available here. |
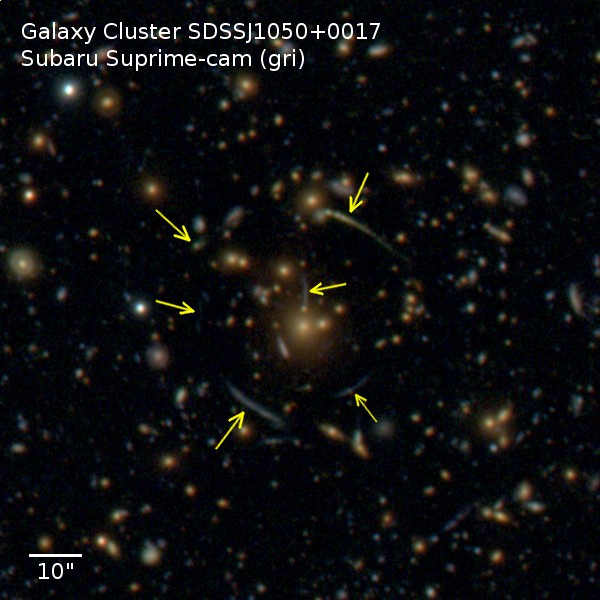 |
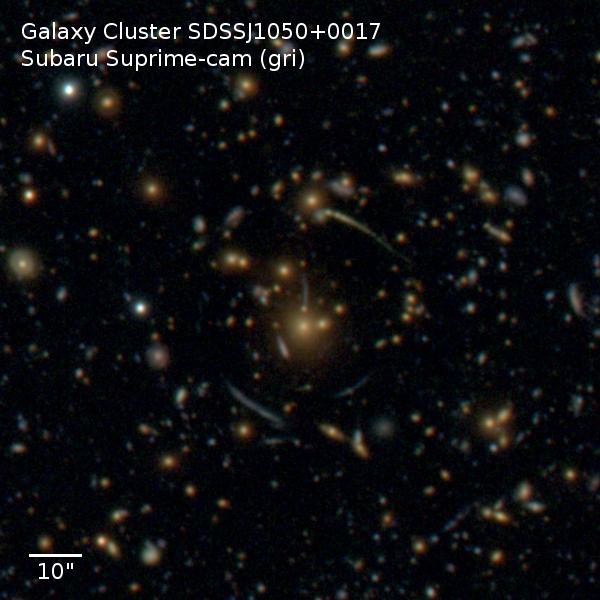
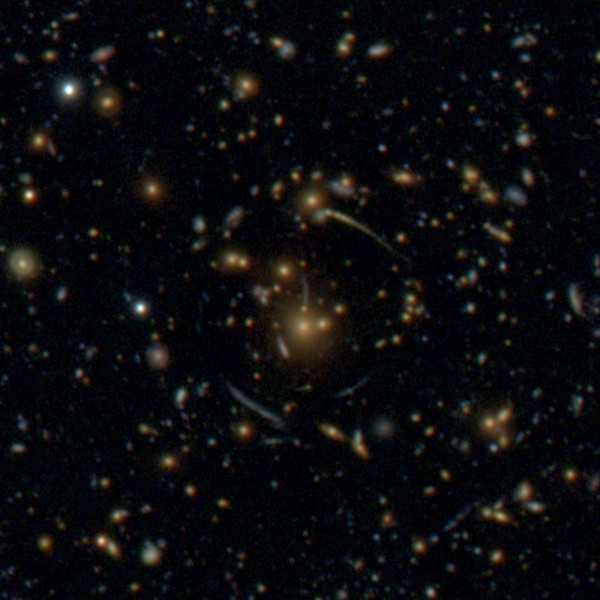
Paper: M. Oguri, et al. MNRAS, 420, 3213 (2012) Credit: U. Tokyo/NAOJ/M. Oguri |
Subaru Suprime-Cam image of the central region of the cluster SDSSJ1050+0017, which was used for the dark matter distribution analysis mentioned above. Arrows indicate strong gravitational lensing features. The version without arrows is available here, the version without caption is here, the image with wider field of view is available here. |
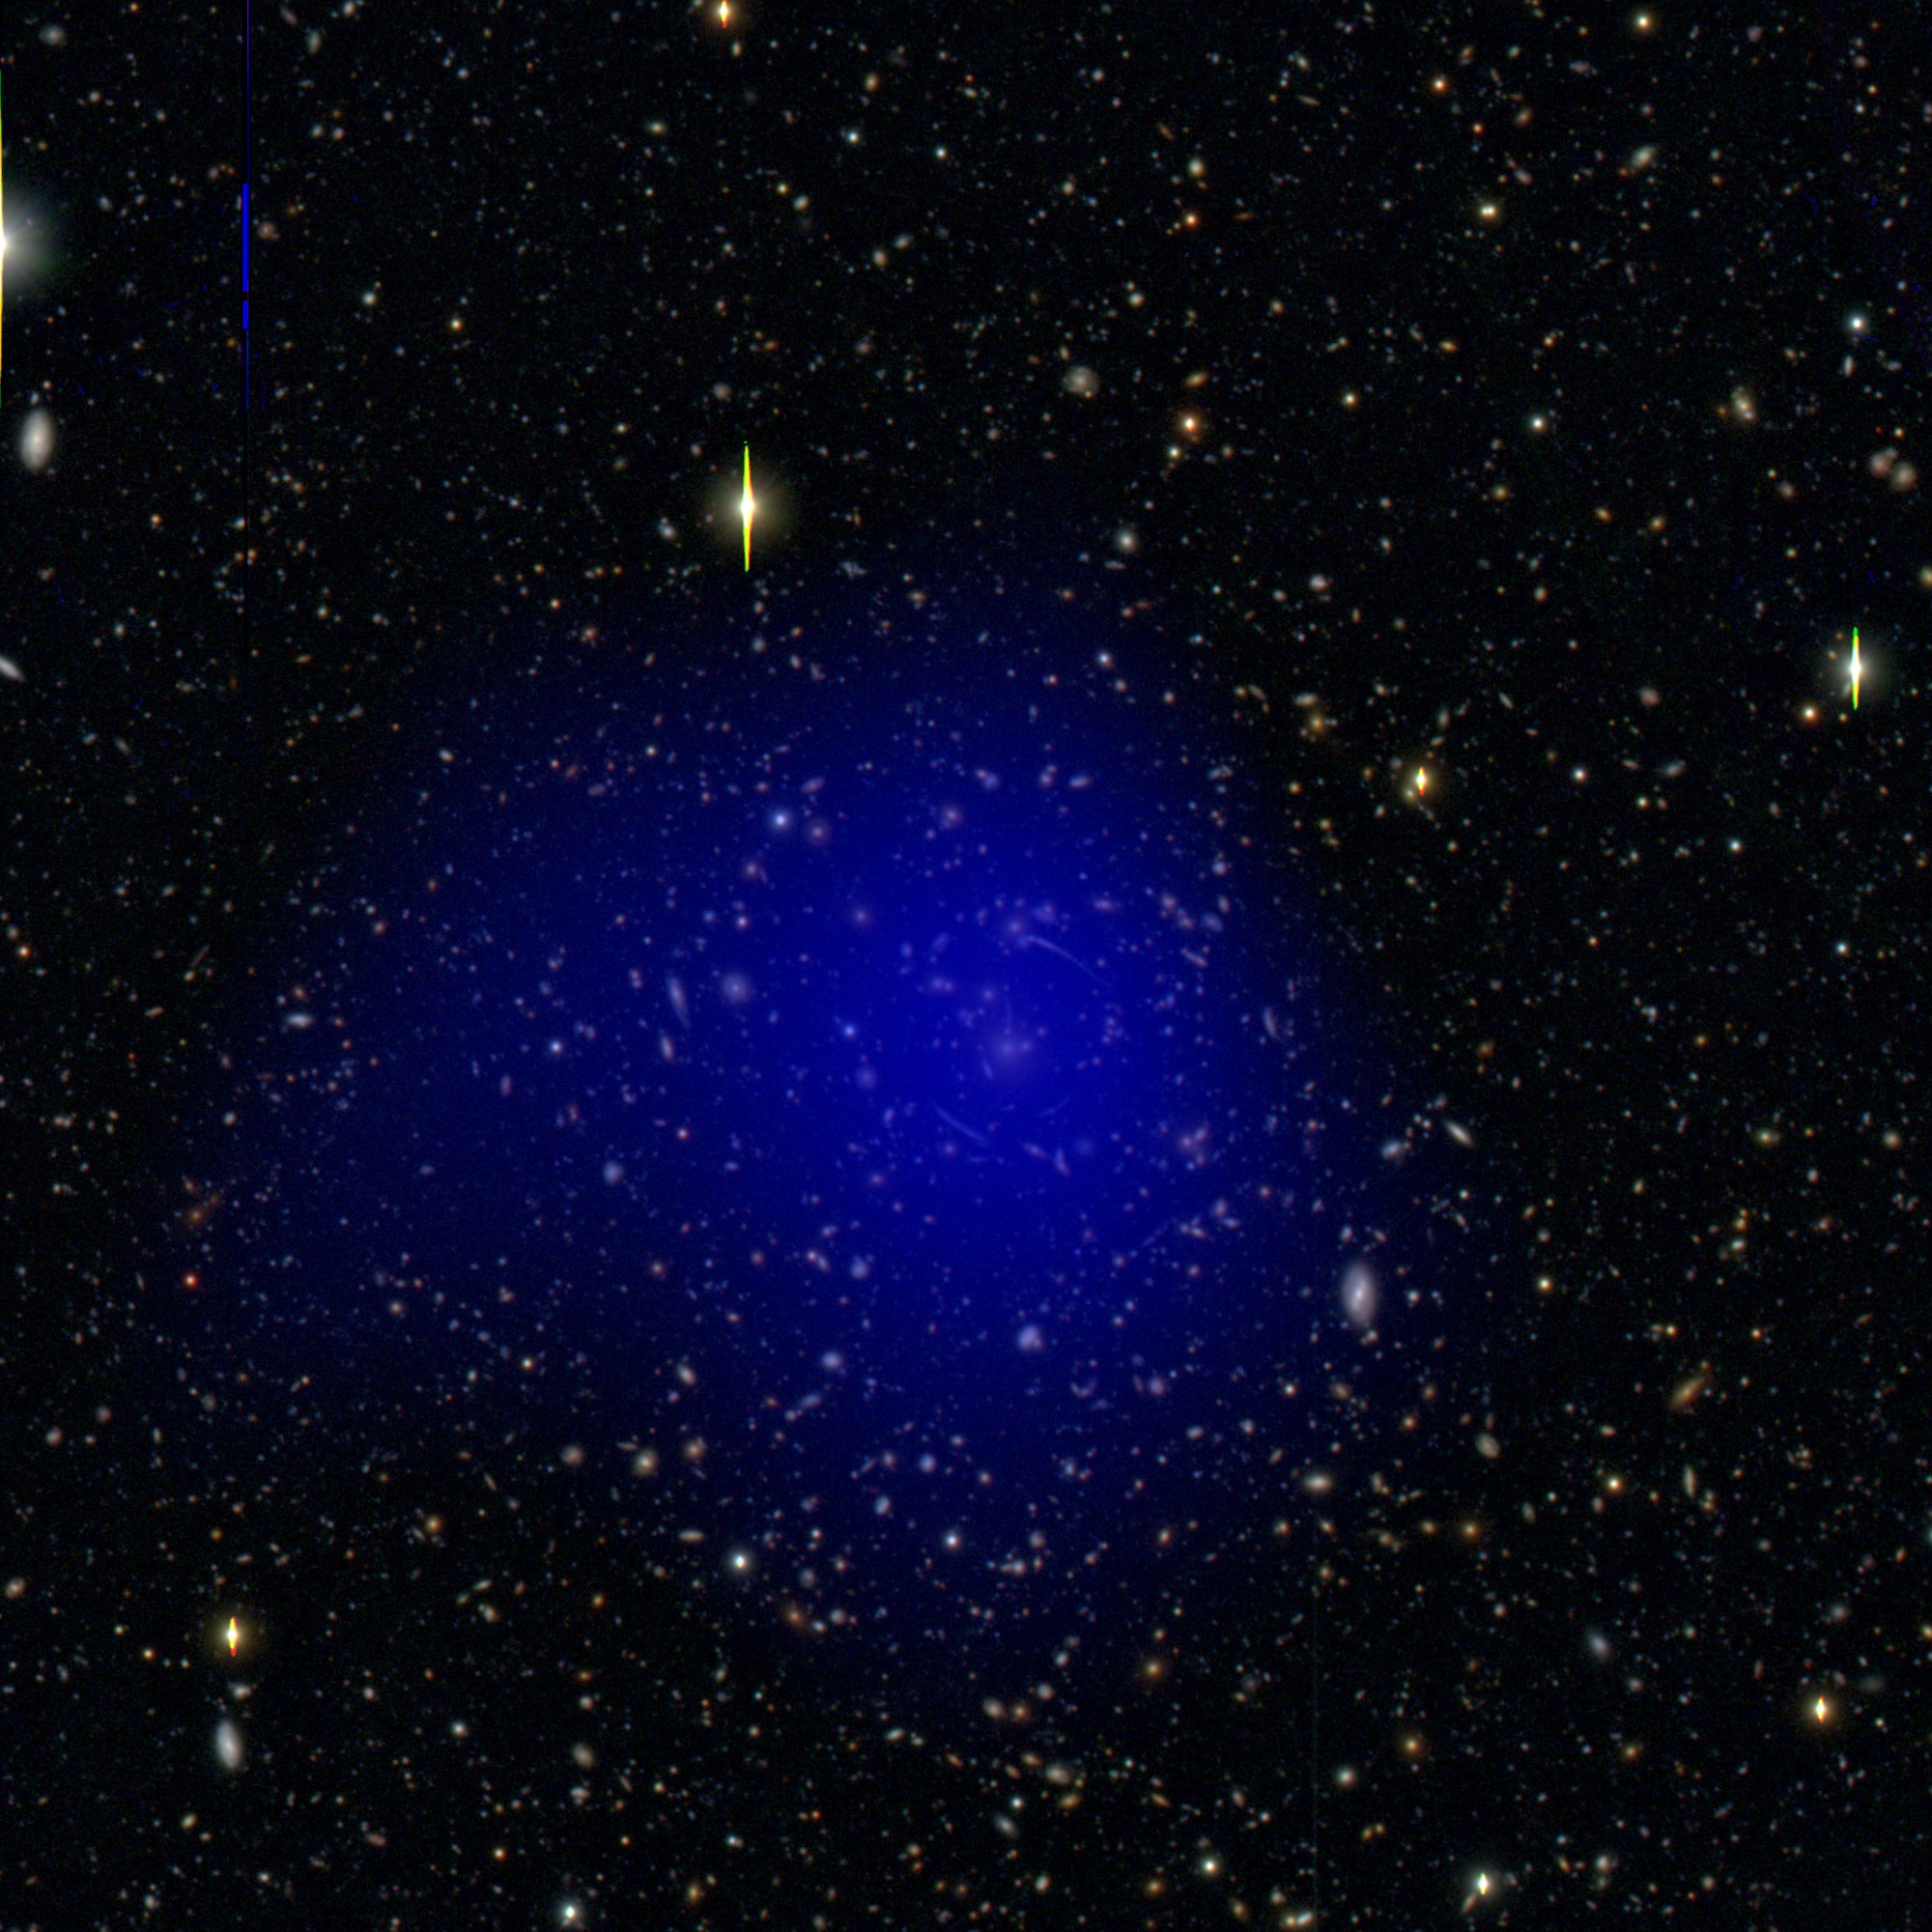  |
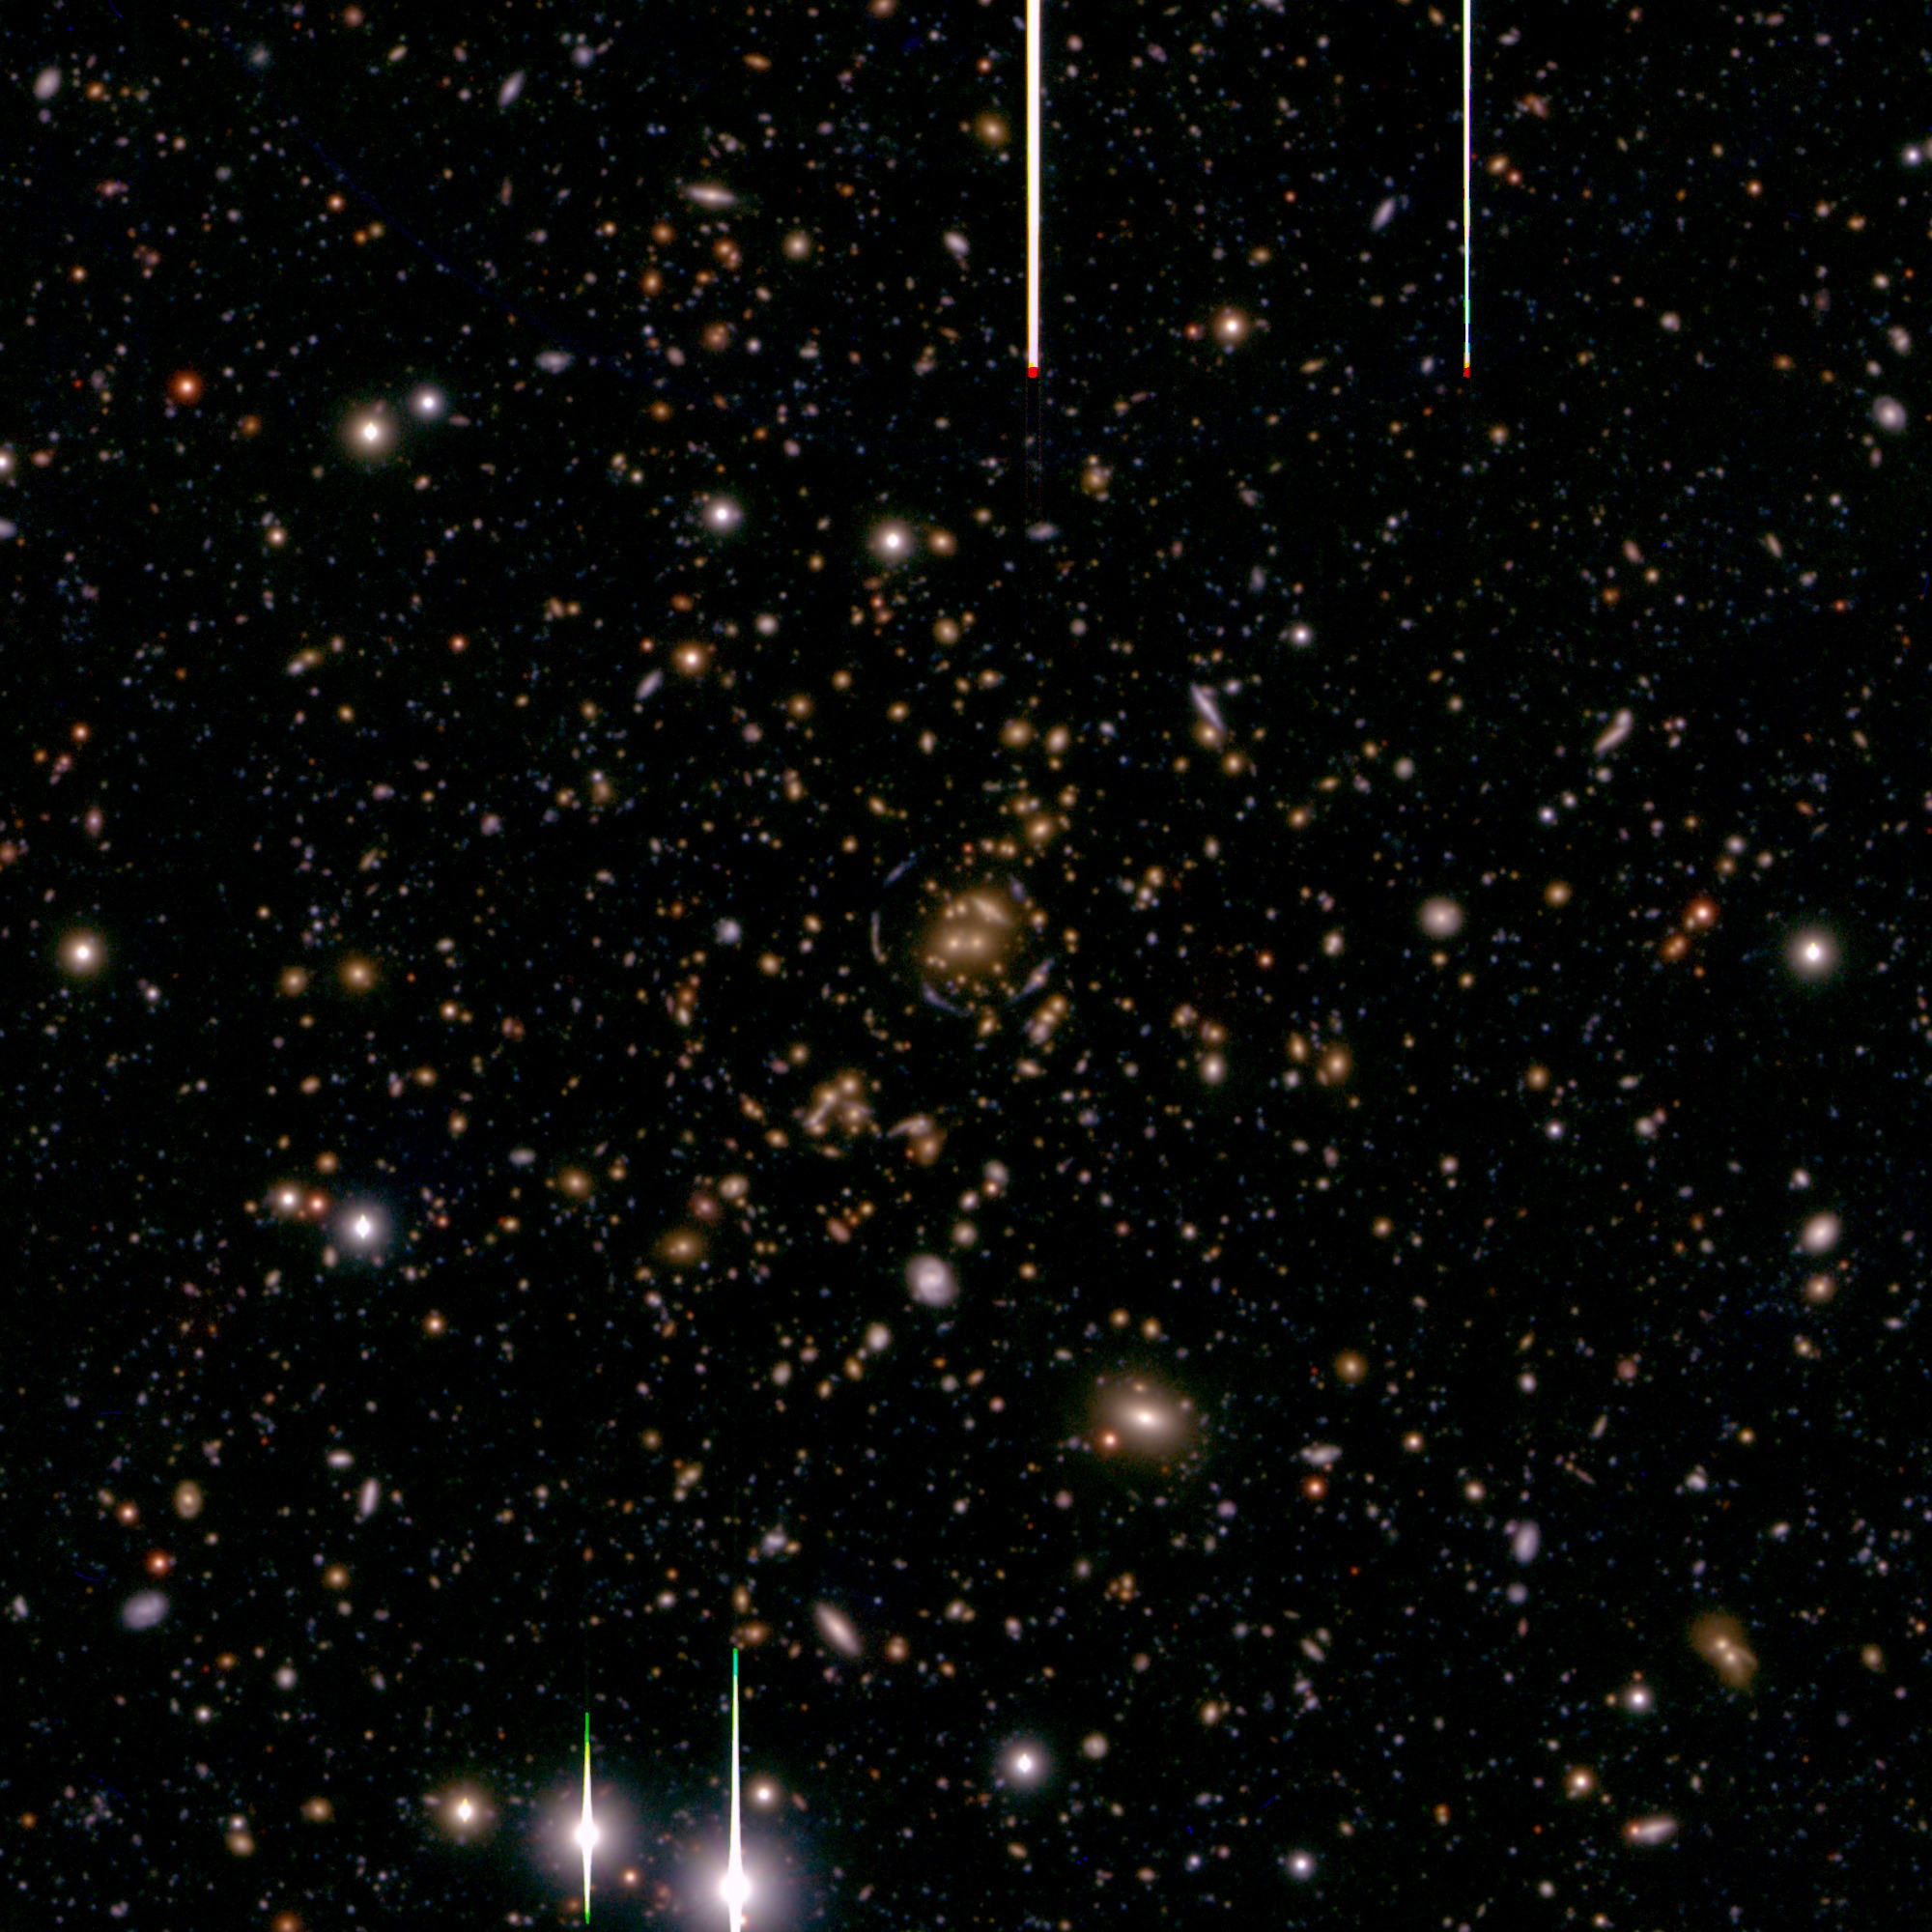
Paper: M. Oguri, et al. MNRAS, 420, 3213 (2012) Credit: U. Tokyo/NAOJ/M. Oguri |
As for above, Subaru Suprime-Cam images of the cluster SDSSJ1050+0017 (upper) and SDSSJ1446+3032 (lower), along with dark matter distributions inferred from weak gravitational lensing analysis (blue). The version without dark matter distribution is available here and here. |
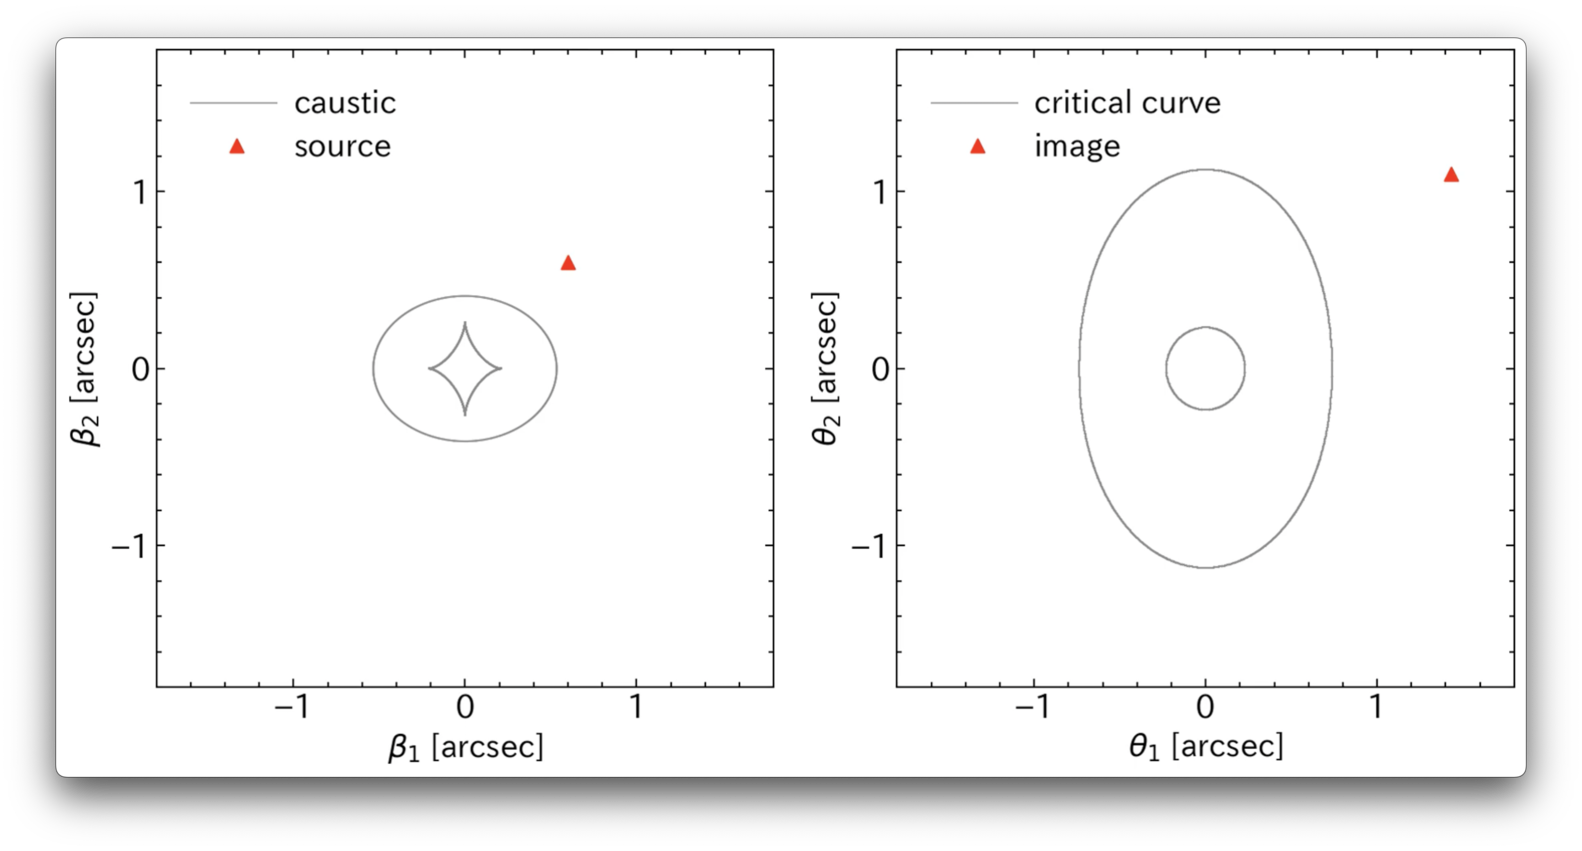 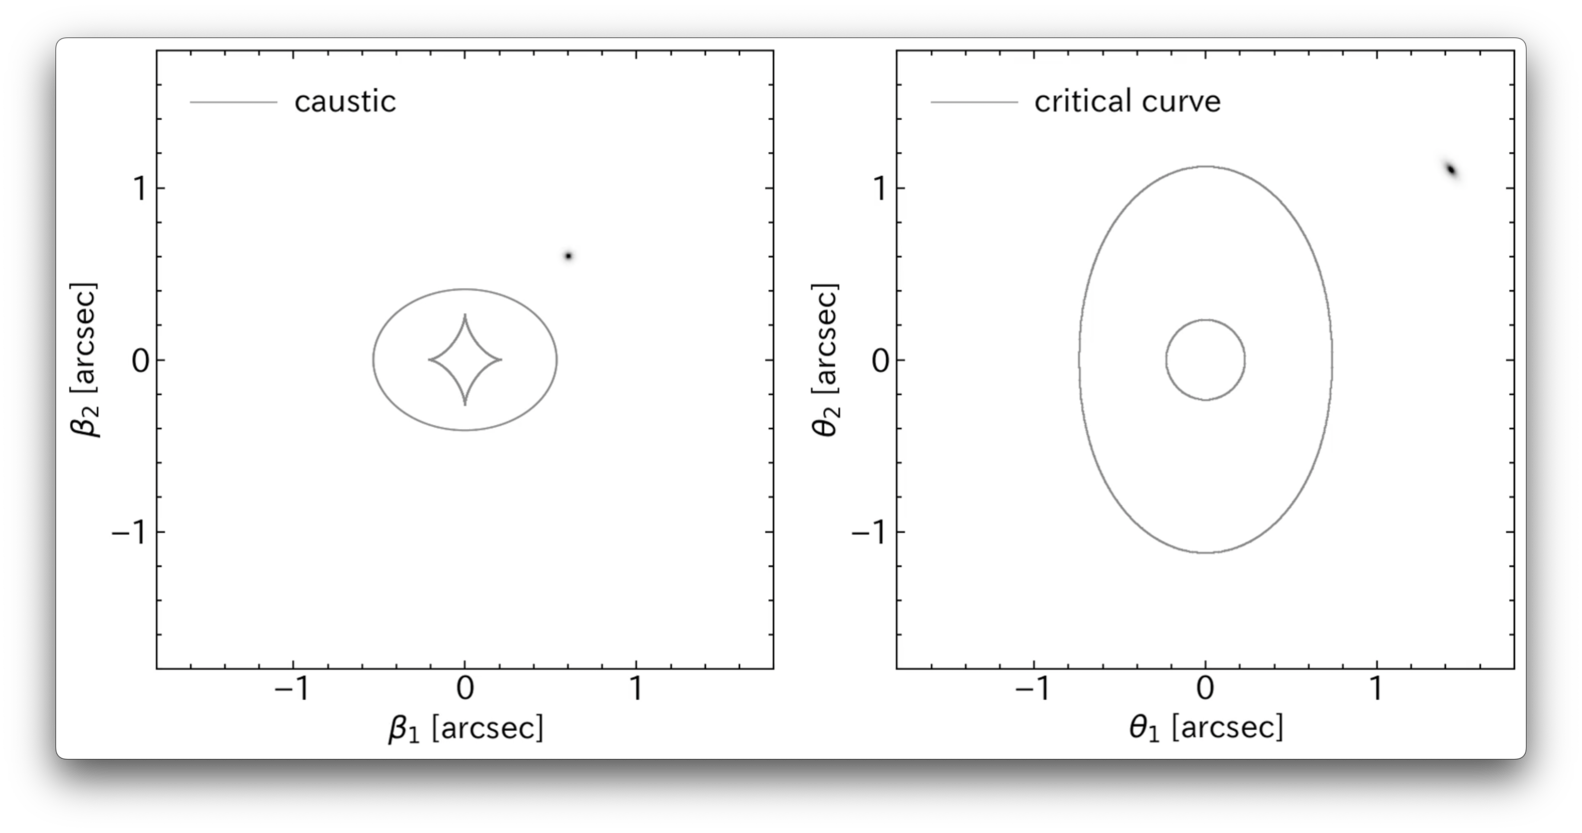 |
Credit: M. Oguri | Animations showing the change of the number of multiple images and their positions for different source positions. Animations both for a point source and for an extended source are available. The mass model is a cored isothermal ellipsoid. Similar animations for a singular isothermal sphere plus external shear are available here and here, and for a singular isothermal sphere are available here and here. |